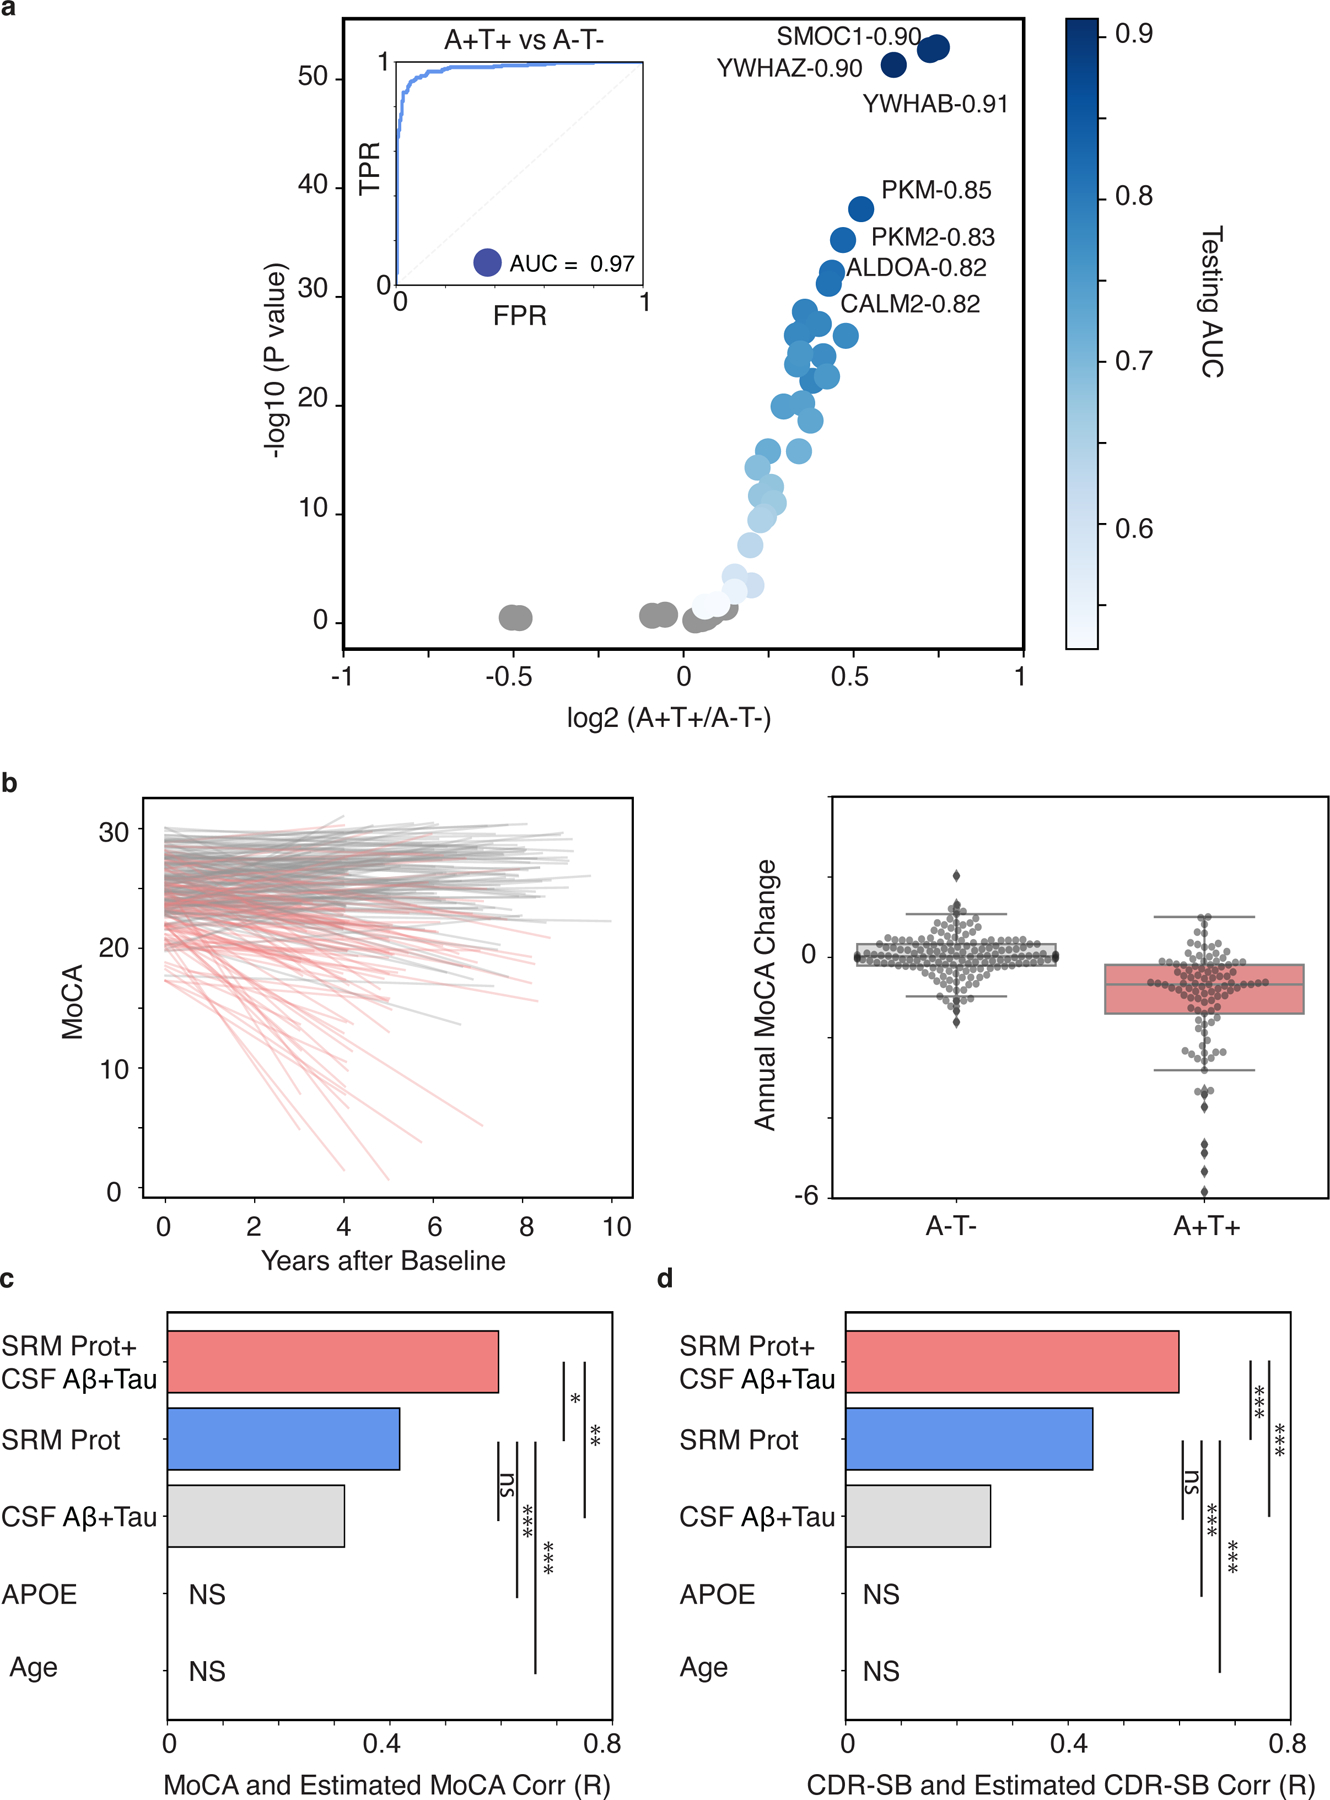
Fig. 4. The CSF 48 panel predicts future change in cognition and dementia severity among in patients with A+T+ biomarker status.

(A) Analytes with FDR-adjusted significant association are shown in shades of blue that reflect their AUC comparing A+T+ versus A-T- status. Non-significant proteins are shown in grey (p > 0.05, FDR corrected). (B) The left panel is a line plot of individual estimates of MoCA decline over time. The color of each line reflects the baseline A/T status. The right panel is a box plot of the annual MoCA change for individuals with baseline A-T- and A+T+. Bar plots show the Pearson correlation coefficients between observed and predicted values of (C) MoCA or (D) CDR-SB for models using the following predictors: 1) the CSF protein panel plus existing AD CSF biomarkers plus (“CSF-48+CSF Aβ42+Tau”), 2) the CSF protein panel alone (“CSF-48”), 3) canonical AD CSF biomarkers alone (“CSF Aβ42+Tau”), 4) APOE E4 dose alone, or 5) Age alone. (*p < 0.05, **p < 0.01, ***p < 0.001. MoCA, n = 101; CDR-SB, n = 113)
