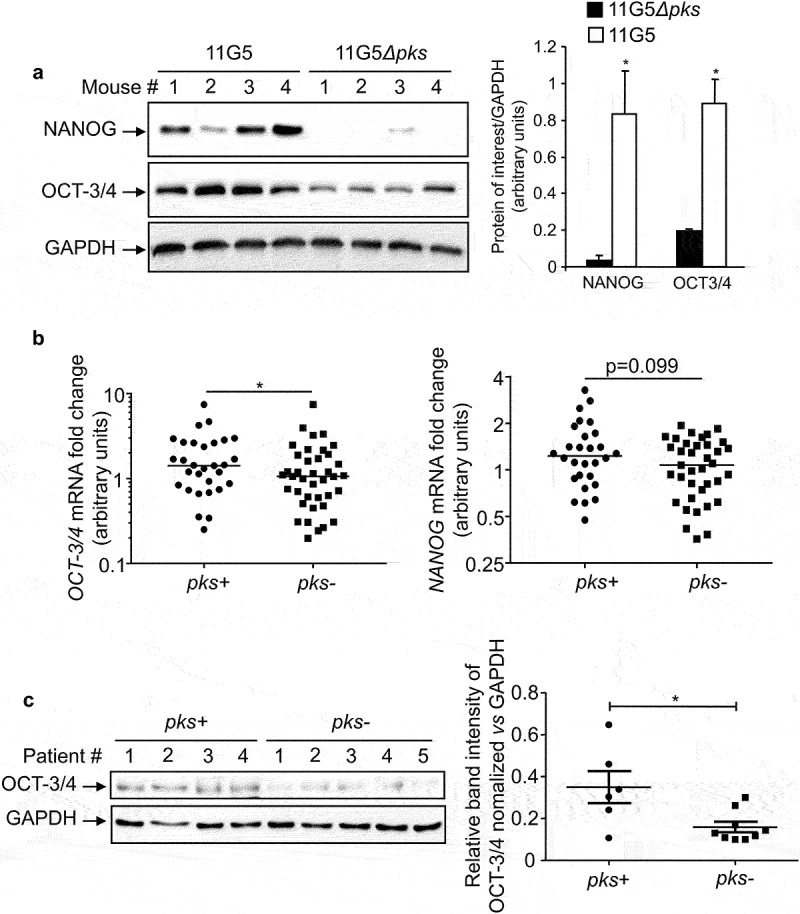
Figure 1.

In vivo overexpression of CSC markers in response to CoPEC infection. (a) Western blot analysis of NANOG and OCT-3/4 expression in tumors collected from AOM/DDS-treated mice infected with the 11G5 strain or the 11G5Δpks strain. Bar graphs on the right represent quantification of bands density using ImageJ software. Values represent means ± SEM; *p < .05. (b) OCT-3/4 and NANOG mRNA levels in the human non-tumoral colonic mucosa colonized by CoPEC (pks+) (N = 30), or by E. coli that did not carry the pks island (pks-) (N = 39), were quantified using qRT-PCR. Medians are represented on the graph; *p < .05. (c) Expression of OCT-3/4 in colonic tumors colonized by CoPEC (pks+) (N = 6), or by E. coli that did not carry the pks island (pks-) (N = 9), was analysed using Western blot. The graph represents the quantification of band intensity using the Image Lab Software from Bio-Rad; *p < .05.
