
Figure 5.
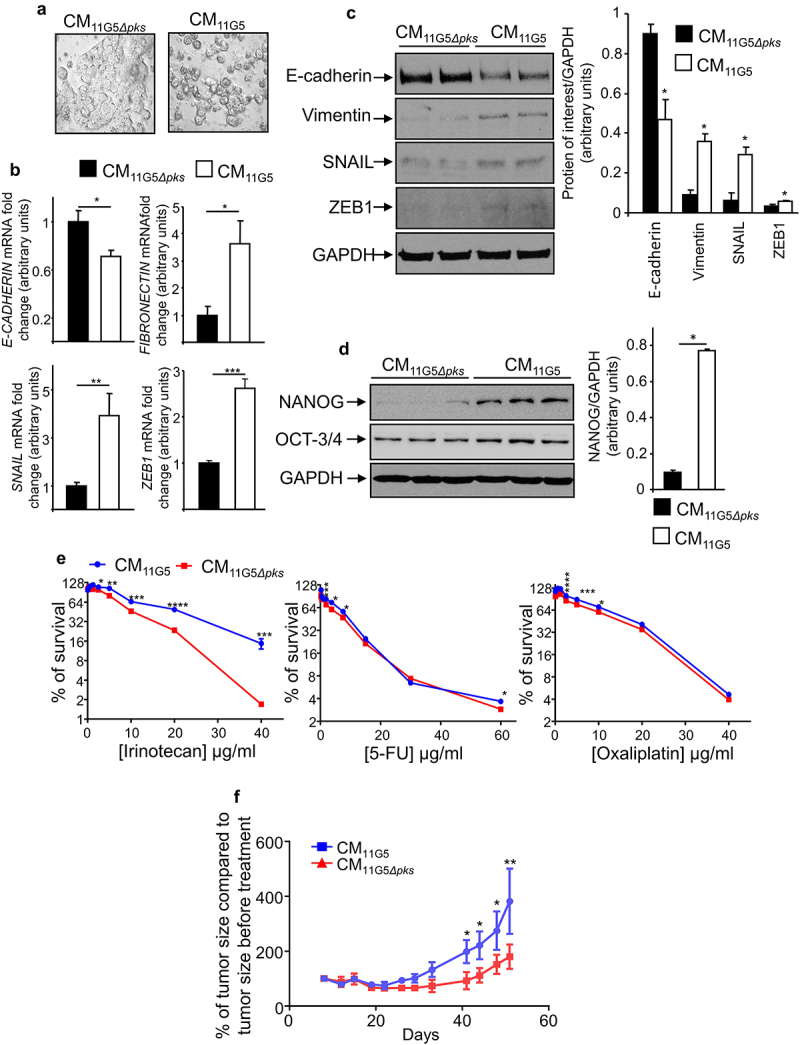
The SASP induced by 11G5 infection promoted the expression of CSC and EMT markers leading to chemoresistance in non-infected human colon cancer cells. (a–f) Cells were infected with the 11G5 strain or the 11G5Δpks strain. Five days post-infection, conditioned media (CM) derived from infected cells were collected and used to culture uninfected cells for 3 days (panel B), 5 days (panels A, C, D, F), 7 days (panel E). CM11G5, CM derived from 11G5-infected cells; CM11G5Δpks, CM derived from 11G5Δpks-infected cells. (a) Representative picture of cells incubated with the indicated CM. (b) E-cadherin, fibronectin, SNAIL, and ZEB1 mRNA levels were quantified using qRT-PCR. Values represent means ± SEM. *p < .05; **p < .01; ***p < 0.001. (c) EMT and (d) the NANOG CSC markers were analysed using Western blot. Bar graphs on the right represent quantification of bands density using ImageJ software. Values represent means ± SEM; *p < .05. (e) Uninfected cells were cultured for 1 week with the indicated CM supplemented with various concentrations of chemotherapeutic drugs. Cell viability was assessed using MTT assay. Untreated cells were used to represent 100% viability. Values represent means ± SEM. *p < .05; **p < .01; ***p < .001; ***p < .0001. (f) After 5 days of culture in the presence of the indicated CM, 106 HT-29 cells were subcutaneously injected into the dorsal flaps of 5-week-old nude mice. 7 days post-engraftment, mice received 30 mg/kg of irinotecan twice weekly for 3 weeks. Tumor sizes were measured using a caliper twice weekly. N = 6 mice for CM11G5 group and N = 5 mice for CM11G5Δpks group. Data are means ± SEM. *p < .05; **p < .01.