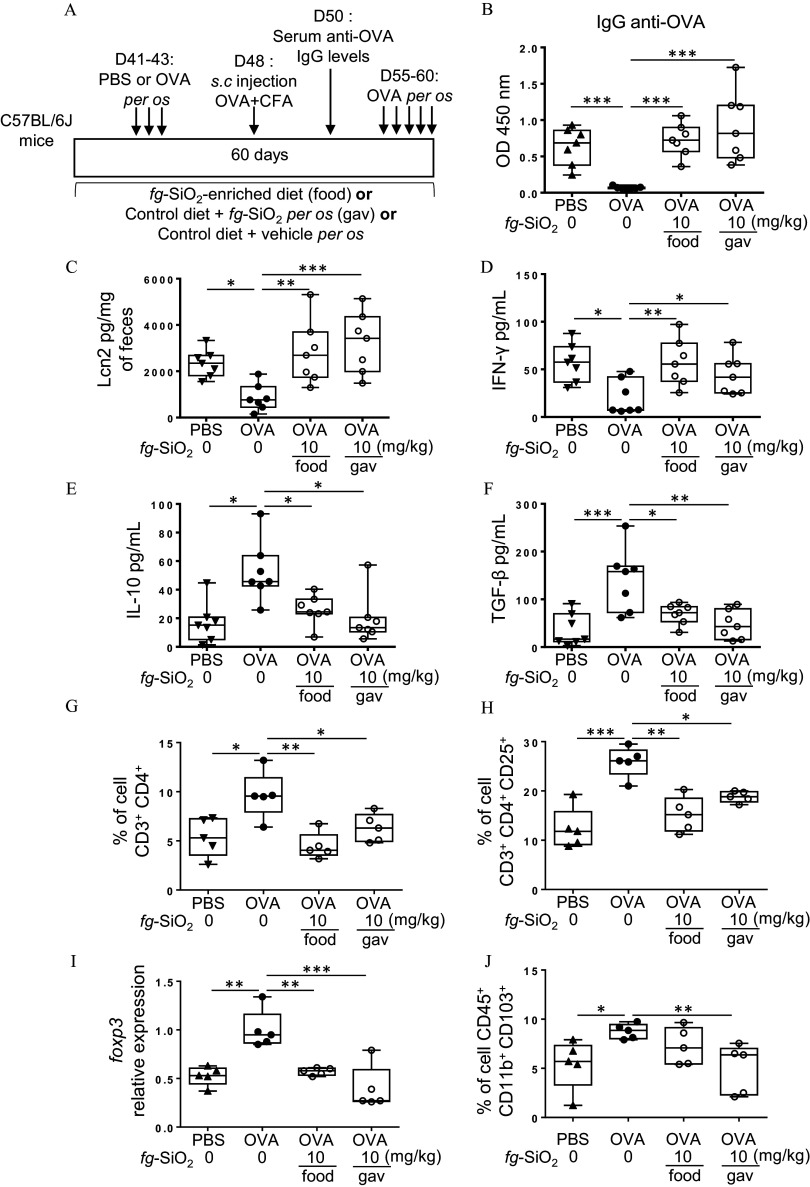
Figure 4.
Evaluation of food matrix effects on food-grade impairment of oral tolerance. (A) The protocol of oral tolerance induction to ovalbumin (OVA) followed by a de novo challenge to OVA in C57BL/6J mice daily treated for 60 d without (water gavage) or with food-grade () ( BW/d) in water suspension [gastric gavage (gav)] or incorporated into food pellets (food). (B) OVA-specific IgG secretion in OVA-immunized (PBS) or OVA-tolerized mice exposed to a vehicle or through gavage (gav) or food ( mice per group). (C) Fecal lipocalin-2 (Lcn2) levels in OVA-immunized (PBS) or OVA-tolerized mice exposed to a vehicle or through gavage (gav) or food ( mice per group). (D–F) Amounts of (D), IL-10 (E), and (F) secreted by mesenteric lymph node cells from OVA-immunized (PBS) or OVA-tolerized mice exposed to a vehicle or through gavage (gav) or food ( mice per group). (G,H) The average frequency of T cells ( ) (G) and T cells ( ) in colon lamina propria of OVA-immunized (PBS) or OVA-tolerized mice exposed to a vehicle or through gavage (gav) or food ( mice per group). Foxp3 transcript expression in colon of OVA-immunized (PBS) or OVA-tolerized mice exposed to a vehicle or through gavage (gav) or food ( mice per group). (J) The average frequency of cells (which fuses DC and macrophage subpopulations) in colon lamina propria of OVA-immunized (PBS) or OVA-tolerized mice exposed to a vehicle or through gavage (gav) or food ( mice per group). The data are expressed as median with interquartile range and whiskers extending from minimum to maximum ± SEM. *; **; *** by one-way ANOVA and post hoc Tukey test (B–I) or Kruskal-Wallis test followed by a post hoc Dunn’s test (J). Data behind graphs are reported in Table S4. Note: ANOVA, analysis of variance; BW, body weight; CFA, complete Freund adjuvant; IgG, immunoglobulin G; , interferon gamma; IL-10, interleukin 10; OD, optical density; PBS, phosphate-buffered saline; SEM, standard error of the mean; , transforming growth factor beta.

