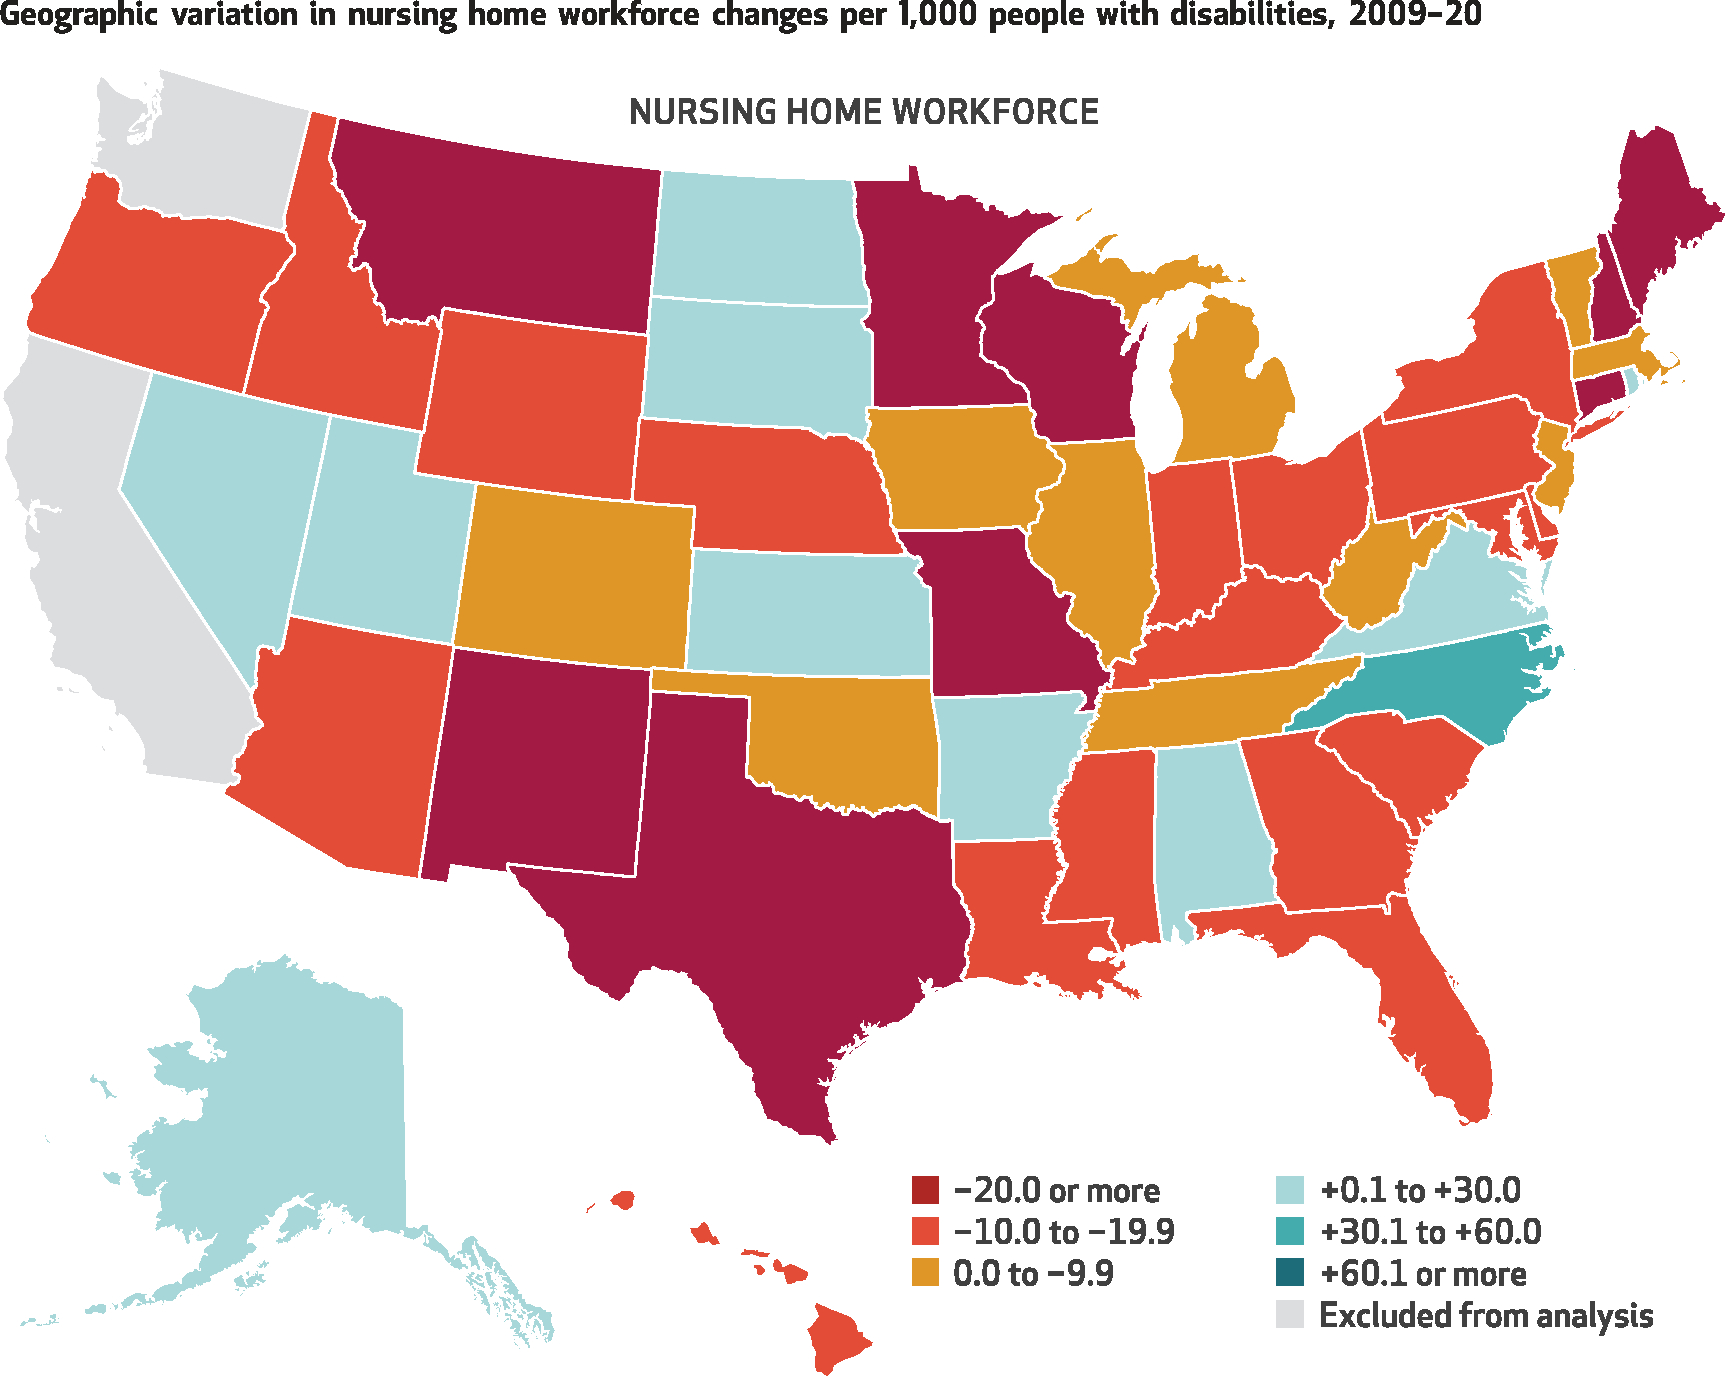
EXHIBIT 2: Geographic variation in nursing home workforce changes per 1,000 people with disabilities, 2009–20.

SOURCES Occupational Employment and Wage Statistics program and American Community Survey, 2009–20. NOTE The omission of California and Washington is explained in the text.
