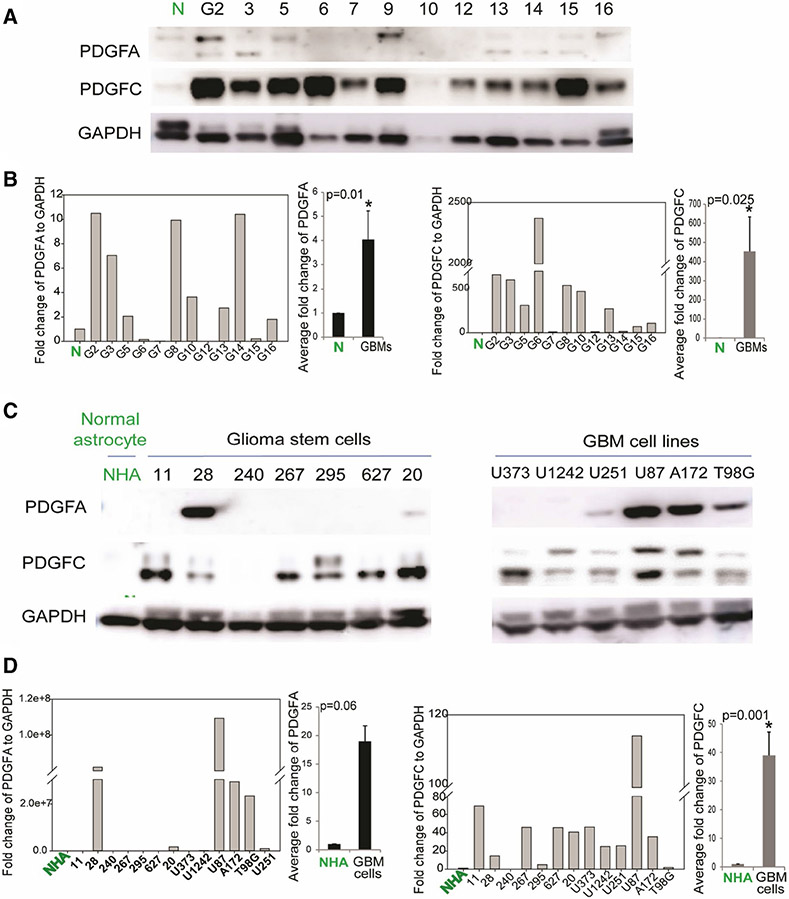
Fig. 4.
PDGFC and PDGFA are upregulated in GBM cells, GSCs and GBM tumors. a Immunoblots showing higher levels of PDGFA and PDGFC protein in a subset of GBM specimens (G) as compared to normal brain (N). b Quantification of PDGFA (left panel) and PDGFC level (middle panel) in GBM specimens as compared to normal brain (P = 0.01 and P = 0.025, respectively). c Immunoblots showing PDGFA and PDGFC levels in GSCs (left panel) and GBM cell lines (right panel) and normal human astrocytes (NHA). d Quantification of PDGFA (left panel) and PDGFC levels (right panel) in GBM cell lines, GSCs as compared to NHA (P = 0.06 and P < 0.001, respectively)

