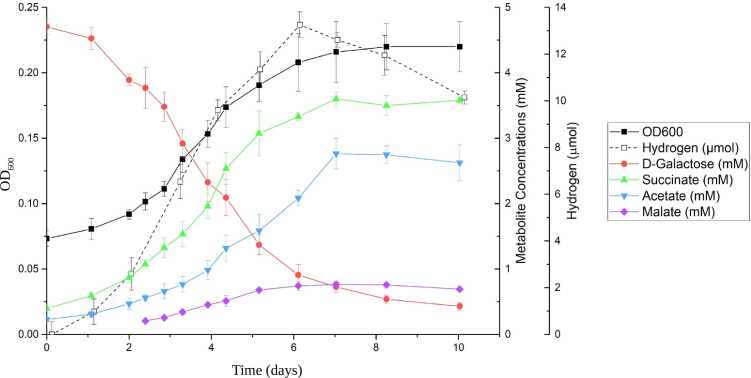
Fig 4.
Time series of major metabolites from D-galactose fermentation by strain NLcol2T. The growth curve was measured by optical density at 600 nm (OD600). D-Galactose decreased while fermentation products of succinate, acetate, malate, and hydrogen gas were produced during anaerobic bacterial growth on D-galactose.

