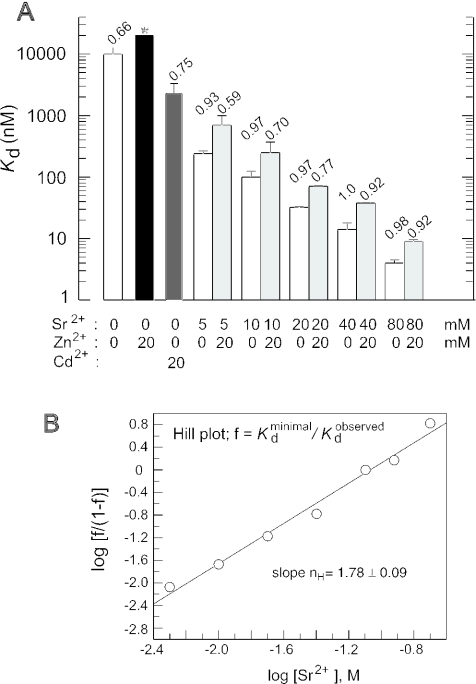
Figure 3.
Kd values for ptRNAGly binding to M1 RNA determined by the spin column assay (8,23). Assay buffers contained 50 mM MES, pH 6.0, 1 M NH4OAc and indicated concentrations of Sr2+ and/or Zn2+. (A) Bar diagram of log Kd dependence on Sr2+ and/or Zn2+ (or Cd2+) concentration as indicated below the diagram. Values above bars represent the proportion of ptRNAGly that was able to form a complex with M1 RNA at the theoretical endpoint (M1 RNA saturation), normalized to conditions of 40 mM Sr2+. Asterisk above the black bar for conditions of 20 mM Zn2+ alone: the experimental endpoint could not be reached due to very weak complex formation, which resulted in high errors for Kd determinations; the Kd of ≥20 μM is therefore only an estimate. Individual values are based on average on four independent experiments; errors are indicated by error bars. (B) Hill plot analysis of Kd dependence on Sr2+ concentration. f = (minimal Kd)/(observed Kd); the minimal Kd at saturating Sr2+ concentrations was determined as 2 nM.

