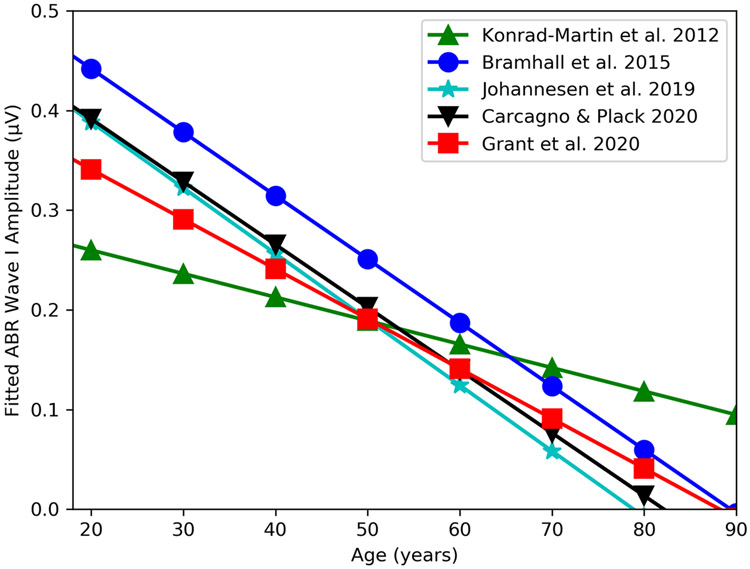
Figure 4. Comparison of relationship between age and ABR wave I amplitude across human studies.
Results of multivariate regression models relating age and ABR wave I amplitude are plotted for five studies. Note that there are some differences between these studies/analyses that may impact the intercept and slope for each study. The Konrad-Martin et al. and Johannesen et al. studies measured wave I amplitude using a mastoid electrode, while the other studies used a tiptrode. Konrad-Martin et al., Johannesen et al., Carcagno & Plack, and Grant et al. used click stimuli, while Bramhall et al. used a 4 kHz toneburst and stimulus presentation level varied across study (Konrad-Martin et al: 110 dB peSPL, Bramhall et al.: 80 dB nHL, Johannesen et al.: 105 dB peSPL, Carcagno & Plack: 105 dB peSPL, Grant et al.: 125 dB peSPL). Pure tone thresholds were averaged over 2, 3, and 4 kHz for the Konrad-Martin et al. study, over .5, 1, 2, and 4 kHz for the Bramhall et al., Johannesen et al., and Carcagno & Plack studies, and over 0.25-8 kHz for the Grant et al. study. In addition to including the predictors age and pure tone average in the regression model, the Bramhall et al. analysis included an interaction effect between age and average pure tone threshold, while the Konrad-Martin et al. study included stimulus rate and an interaction between stimulus rate and age. The data from Johannesen et al, Carcagno & Plack, and Grant et al. were reanalyzed so that the regression models were similar to the models from the other two studies. To be consistent with the other studies, Carcagno & Plack’s unmasked ABR wave I amplitude data recorded using a tiptrode and Grant et al.’s unmasked ABR data measured from peak to the following trough was used for the modeling. The revised regression models included age and average pure tone thresholds as predictors of wave I amplitude. Sex was also included as a predictor for the Carcagno & Plack and Johannesen et al. datasets. As in Bramhall et al. and Konrad-Martin et al., subject-specific random effects were used to account for variation in wave I amplitude due to sex/head size and the correlation between the two ears of a subject for the Grant et al. dataset, which included data for the right and left ears of each subject. For the purpose of plotting, average pure tone thresholds were set to 15 dB HL, sex was set to male, and rate was set at 11/sec. Equations are as follows, Bramhall et al.: y= 0.72597 -(0.00892 * age) – (0.01044 * 15) + (0.00017 * age *15), Konrad-Martin et al.: y=0.39448 - (0.00395 *15) – (0.00255 * 11) – (0.00269 * age) + (0.00003 * 11 * age), Johannesen et al.: y = 0.5264 – (0.0066 * age) - (0.0004 * 15), Carcagno & Plack: y = 0.5181 – (0.0063 * age) - (0.00003854 *15), Grant et al.: y = 0.537 - (0.006 * age) – (0.004 *15).

