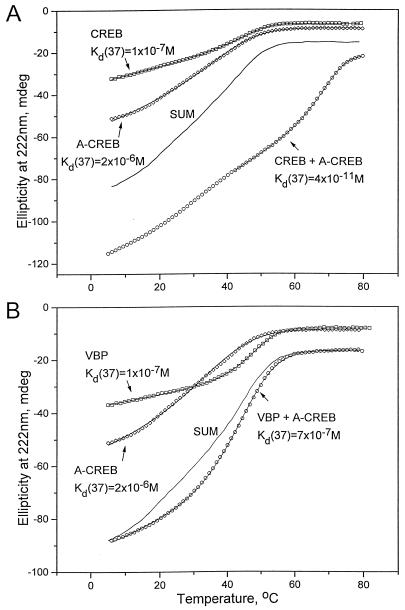
FIG. 2.
Thermal stability of A-CREB mixed with CREB or VBP. (A) CD thermal denaturation curves recorded at 222 nm for CREB (squares), A-CREB (diamonds), and a mixture of CREB and A-CREB (circles). The solid line labeled SUM is expected if CREB and A-CREB do not interact. The line through each data set is a fitted curve that was used to calculate Tm as described previously (33), and the calculated Kd(37) is shown. (B) CD thermal denaturation curves at 222 nm of VBP (squares), A-CREB (diamonds), and a mixture of VBP and A-CREB (circles). The solid line labeled SUM is expected if VBP and A-CREB do not interact. (C) A schematic representation of an A-CREB–CREB dimer. The left panel shows a CREB homodimer with unhelical basic regions. The right panel shows a heterodimer of CREB and A-CREB resulting in an α-helical formation of the basic region.


