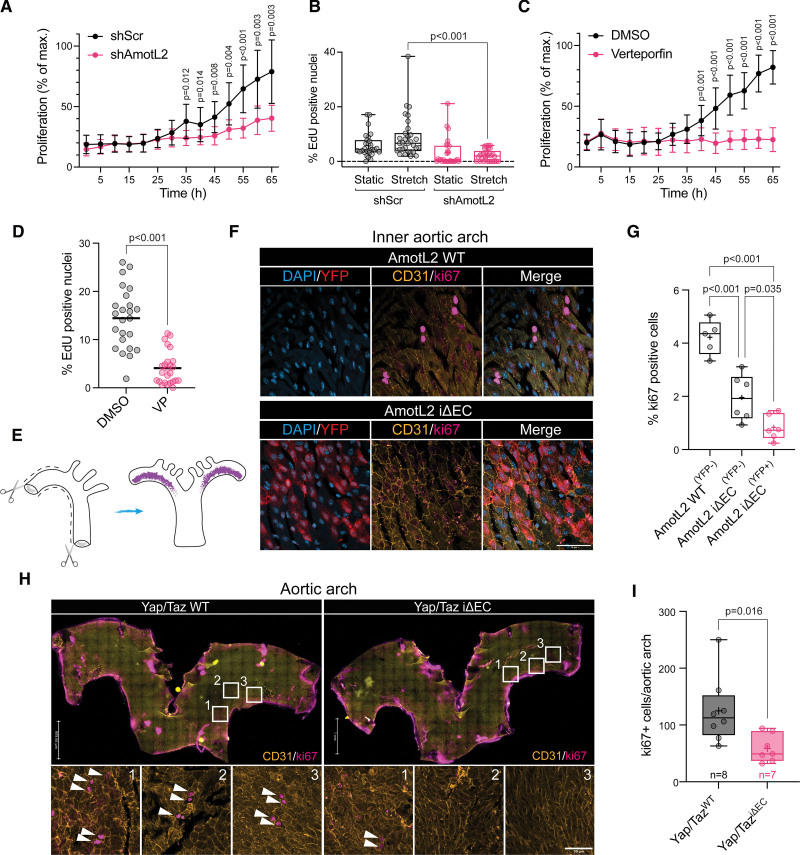
Figure 5.
Endothelial proliferation is regulated by AmotL2 (angiomotin-like 2) and YAP (Yes-associated protein). A, Proliferation of human umbilical vein endothelial cell (HUVEC) replated to gelatin-coated plastic following 48-hour postlentiviral transduction with shScr (shRNA scrambled control) or shAmotL2 lentivirus. n=3 independent experiments (mean±SD, 2-way ANOVA with Sidak multiple comparisons). Error bars indicate SD. B, Proliferation of shScr- and shAmotL2-treated HUVECs exposed to uniaxial 12% stretched for 16 hours before 5-ethynyl-2′-deoxyuridine (EdU) incorporation and imaging. Box plots showing quantification of EdU, where the percentage of EdU-positive cells was calculated against the total number of cells stained with Hoechst. Each data point represents one field of view from n=4 independent experiments (mean±SD, Kruskal-Wallis with Dunnet multiple comparisons). C, Proliferation of HUVECs plated to gelatin-coated plastic and treated with 0.2 μg/mL verteporfin (VP) or DMSO vehicle, n=3, error bars indicate SD. D, Quantification of EdU-positive HUVECs treated with 0.2 μg/mL VP or DMSO vehicle (48 h). Cells were counterstained with Hoechst and quantified where the percentage of EdU-positive cells was calculated against the total number of cells stained with Hoechst (each data point represents 1 field of view from n=4 independent experiments, bar indicates mean, Mann-Whitney U test). E, Schematic depicting dissection of whole aorta for en face whole-mount staining. Purple region indicates the inner aortic arch. Schematic drawn using Adobe Illustrator (v25.4.1). F, Representative images of the inner aortic arch of AmotL2 wild-type (WT) and AmotL2 iΔEC, en face whole mount–stained for YFP (yellow fluorescent protein; red), nucleus (blue), CD31 (yellow), ki67 (magenta), using the ChrisLUT BOP palette (https://github.com/cleterrier/ChrisLUTs). Scale bar, 50 µm. Images representative of n=5 mice per group. G, Quantification of total ki67- and CD31-positive cells per aortic inner arch from AmotL2 WT (YFP −neg), n=5; AmotL2 iΔEC (YFP −neg), n=5; and AmotL2 iΔEC (YFP +pos), n=5 (mean±SD, 1-way ANOVA with Tukey multiple comparisons). H, Representative images of the inner aortic arch of Yap/Taz WT and Yap/Taz iΔEC, en face whole mount–stained for CD31 (yellow), nucleus (blue), and ki67 (magenta). White arrows indicate ki67-positive cells. Scale bar, 50 µm. I, Quantification of total ki67- and CD31-positive cells per aortic inner arch from Yap/Taz WT (n=5) and Yap/Taz iΔEC (n=5; mean±SD, Mann-Whitney U test).

