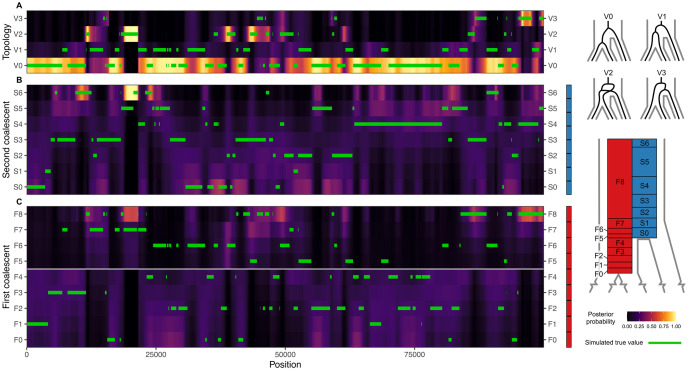
Fig 3. Posterior probability for the topology (A), second coalescent event (B) and first coalescent event (C) of a 100 kb msprime simulation.
“First” and “second” refer to the order in which coalescent events happen, backwards in time. The true empirical topology and coalescent times are plotted as green lines.

