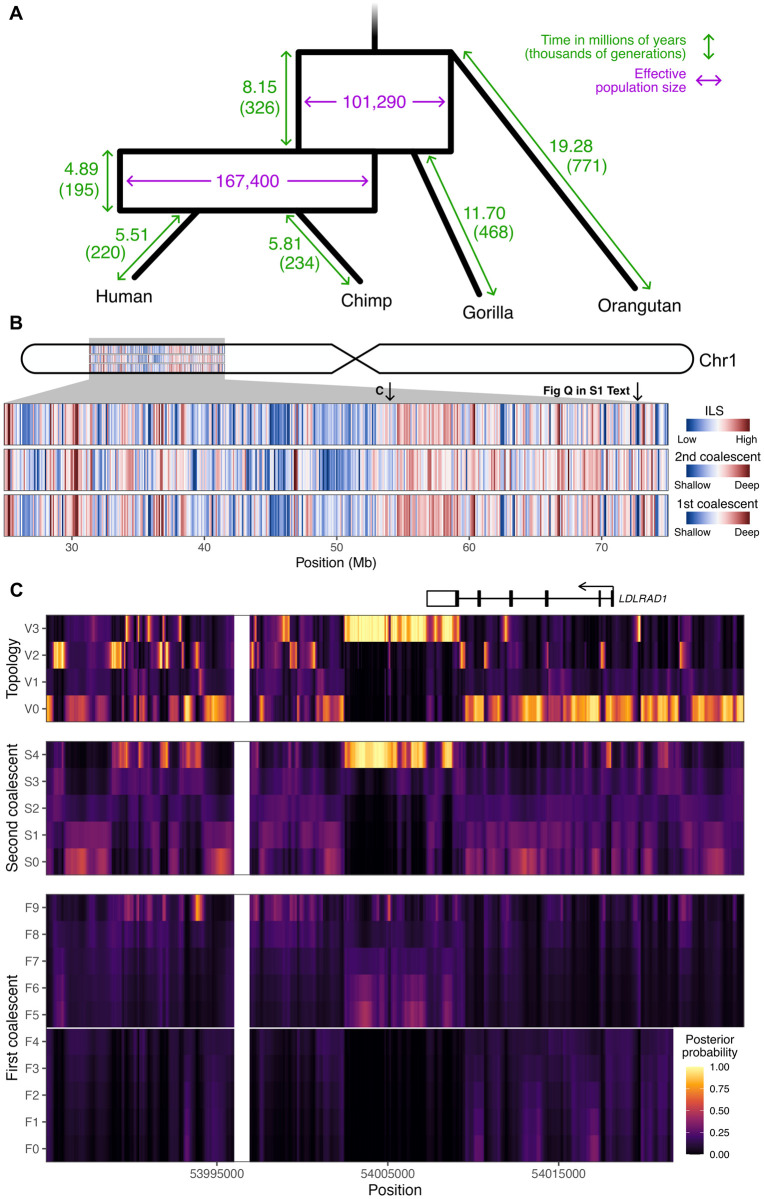
Fig 5. TRAILS output for 50 Mb of chromosome 1 of the HCGO alignment.
(A) Estimates for the speciation times (green) and ancestral Ne (purple) of the speciation process, optimized using TRAILS and assuming a mutation rate of μ = 1.25 × 10⁻⁸ per site per generation. To convert time from generations to millions of years, a generation time of g = 25 years per generation was used. (B) Genome-wide variation of ILS, and first and second coalescent times. (C) Posterior decoding of the topology, and first and second coalescent events for a zoomed-in region in chromosome 1. As in Fig 3, both V0 and V1 correspond to the species topology (((H,C),G),O);, V2 corresponds to (((H,G),C),O);, and V3 to (((C,G),H),O);. The LDLRAD1 gene is plotted on top, where exons are represented as boxes, coding regions as filled boxes, and introns as horizontal lines.

