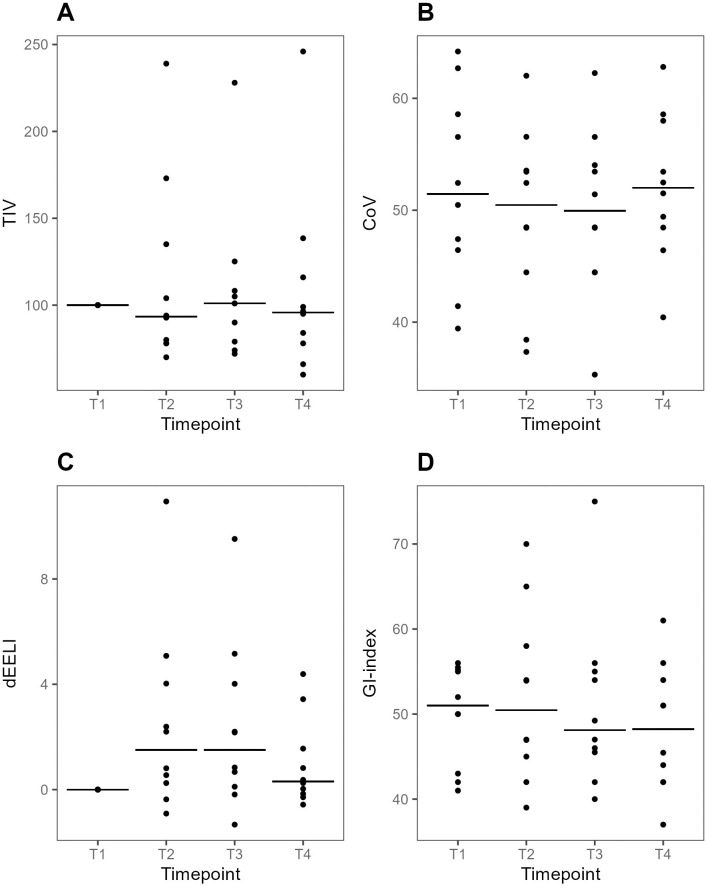
Fig 2. Plots of global EIT-variables at supine baseline, during prone positioning and after supine repositioning.
Individual values and medians at each time point. A. Tidal impedance variation (TIV) relative to T1 (reference value 100 AU). B. Center of ventilation (CoV). At CoV = 50%, the gravitation point of the ventilation is at the center of the chest diameter. A higher number indicates a ventral over-weight whereas a lower number indicates a dorsal over-weight of the ventilation distribution. C. Delta end-expiratory lung impedance (dEELI) relative to T1 (reference value 0). D. Global inhomogeneity (GI) index. A higher value indicates a more heterogenous spatial distribution of ventilation across the lung. dEELI at T3 was higher than dEELI at T1, median difference 1.51 (95% CI 0.19–5.16, p = 0.04). T1-4: predefined data collection timepoints. T1, Supine baseline. T2, 30 min after prone positioning. T3, 60 min after prone positioning. T4, 30 min after supine repositioning.

