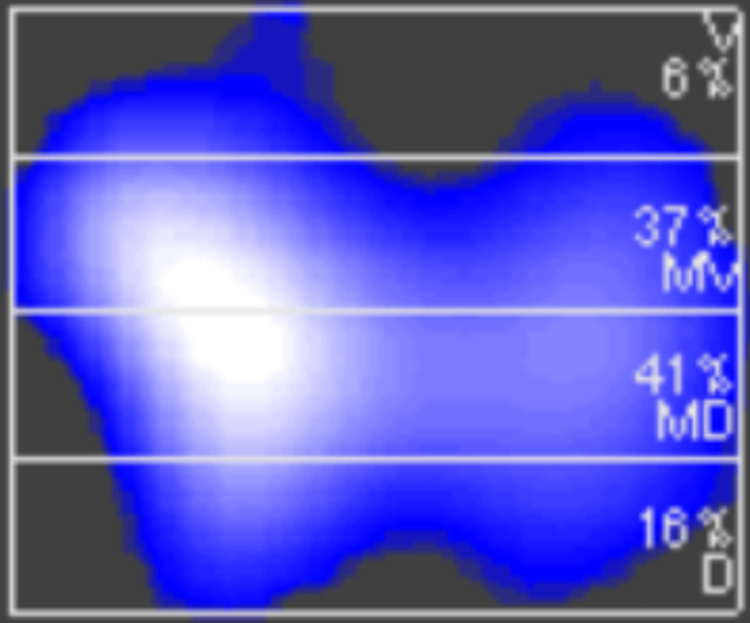
Fig 3. Example of a reconstructed EIT-image horizontally divided into four equally spaced regions of interests.
Percentages in each region of interest represent the fraction of global tidal impedance variation. EIT, electrical impedance tomography. D, Dorsal. MD, mid-dorsal. MV, mid-ventral. V, ventral.

