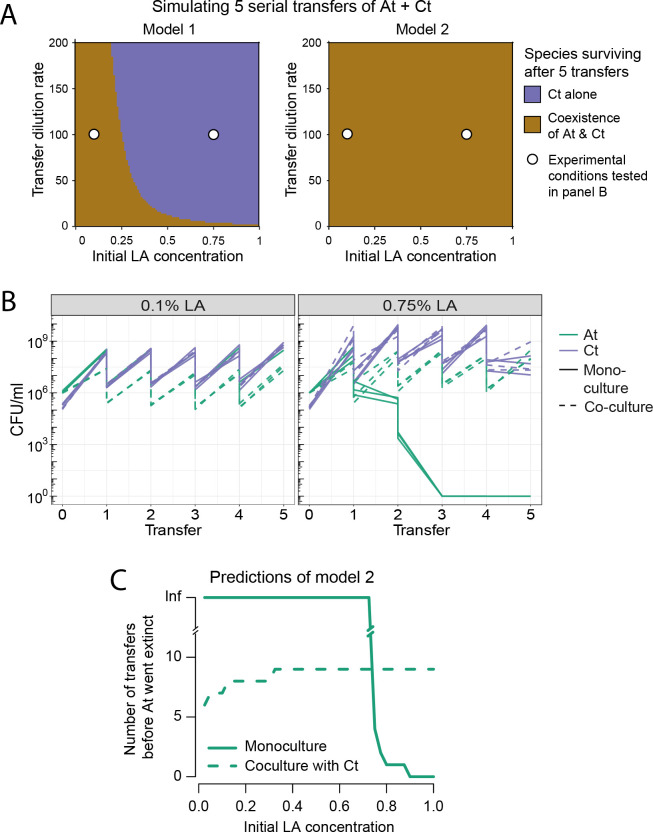
Fig 4. Coexistence experiments and models.
(A) Prediction of short-term coexistence over 5 simulated serial transfers of the co-culture of At and Ct according to model 1 (left) and model 2 (right): Both models allow for short-term coexistence, but the parameter space in which this is possible is larger in model 2 (panel B, larger area representing coexistence compared to Ct surviving alone). White circles indicate the conditions in which experiments were run, as shown in panel B. (B) 5-Transfer experiment of At and Ct in mono- and co-culture at both 0.1% (left) and 0.75% LA (right). We show the population size in the initial culture (“transfer” 0), which is then quantified at each transfer (every 72 h). We illustrate the 100-fold dilution at each transfer, although this is not explicitly quantified. All 3 technical replicates per condition are shown. At mono-culture goes extinct as expected in 0.75% LA, but the 2 species coexist at both LA concentrations, as correctly predicted by model 2 in panel A. (C) Model 2 predicts that At should survive indefinitely in mono-culture at a 100-fold dilution rate up to 0.75% LA. In co-culture, Ct excludes it after a few transfers at low LA concentrations, but as the concentration increases, At can survive for longer in co- compared to mono-culture, meaning that Ct facilitates At’s survival by extending its duration (see also S3 Fig). The data underlying this figure can be found at https://zenodo.org/records/8033845. LA, linoleic acid.

