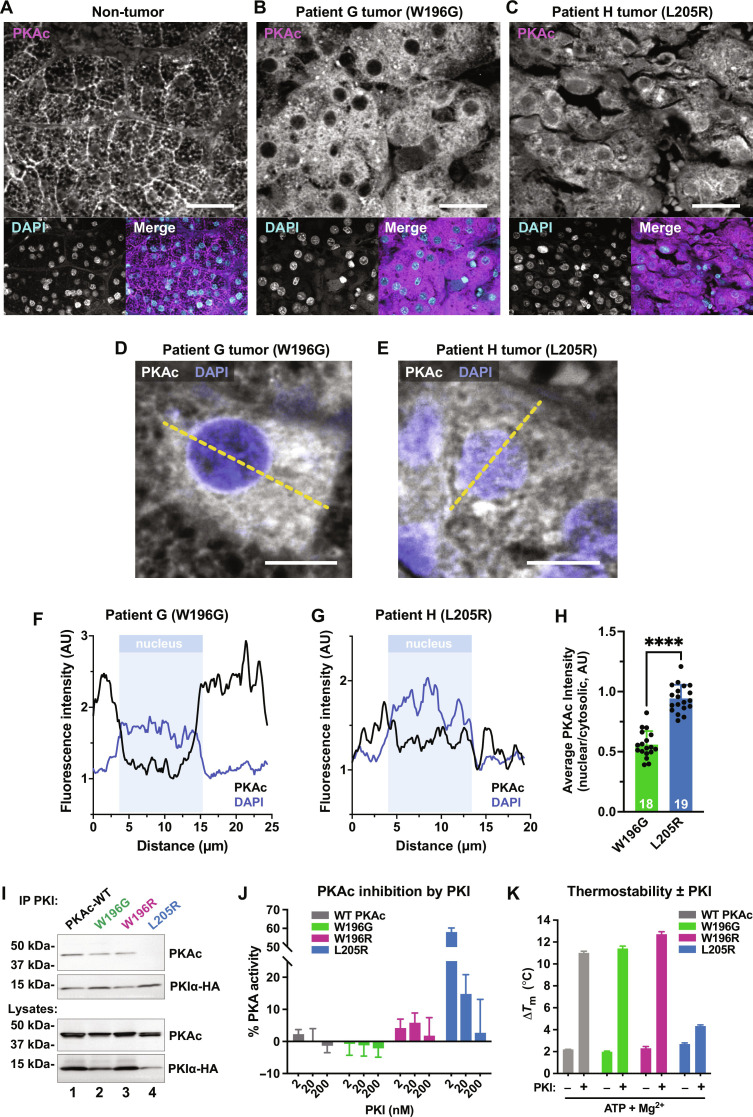
Fig. 2. Patient tissue analyses reveal a distinct subcellular distribution of PKAcW196G.
(A to C) Patient adrenal tissue and Cushing’s adenomas stained for PKAc (magenta) and nuclei [4′,6-diamidino-2-phenylindole (DAPI), cyan]; patient G adjacent non-tumor (A), patient G tumor (B), and patient H tumor (C). Scale bars, 30 μm. (D and E) High magnification of patient tumors stained for PKAc (white) and nuclei (DAPI, blue); patient G (D), and patient H (E). Yellow dashed line represents measurements depicted in (F) and (G). Scale bars, 10 μm. (F and G) Line plot quantification of PKAc subcellular distribution. Example trace of PKAc (black) and DAPI (blue) signals versus distance. Nuclear bounds are indicated (pale blue shading); patient G, PKAcW196G (F); patient H, PKAcL205R (G). (H) Quantitation of PKAc intensity measurements, nuclear/cytosolic. Means ± SD; n ≥ 18; ****P ≤ 0.0001, Student’s t test. AU, arbitrary units. (I) Immunoprecipitation of PKI from human embryonic kidney (HEK) 293T cells expressing PKIα-HA along with V5-tagged PKAc variants: WT PKAc (lane 1), PKAc-W196G (lane 2), PKAc-W196R (lane 3), and PKAc-L205R (lane 4). Representative of three experimental replicates. (J) Inhibition of PKAc activity toward Kemptide peptide substrate relative to buffer controls for each variant upon increasing concentrations of PKI. Means ± SE; n = 3. (K) Thermostability measurements for each PKAc variant ± PKI. Experiments conducted in the presence and absence of Mg2+ adenosine 5′-triphosphate (ATP). Means ± SE; n = 3.

