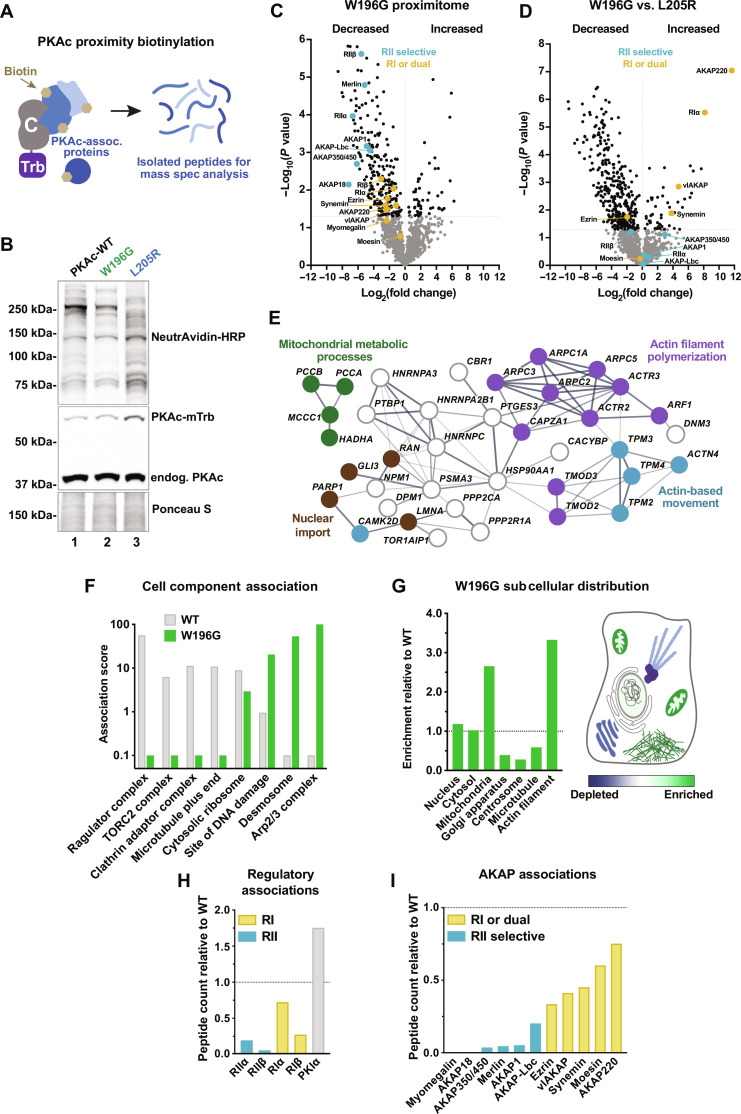
Fig. 3. PKAcW196G is differentially compartmentalized in adrenal cells.
(A) Diagram depicts biotin-labeled proteins surrounding PKAc-miniTurbo in live cells and the final isolated peptides after streptavidin capture and trypsin digest. Labels: C, PKAc; Trb, miniTurbo. (B) Immunoblot of lysates from stable PKAc-miniTurbo H295R cell lines upon 48 hours of doxycycline induction and 2 hours of biotin incubation. NeutrAvidin-HRP labels biotinylated proteins. Expression of each PKAc-miniTurbo variant is indicated above each lane. Representative of four biological replicates. (C and D) Volcano plots of proximity proteomics for PKAc-W196G versus WT PKAc (C) and PKAc-W196G versus PKAc-L205R (D). Proteins underrepresented (left) and enriched (right) in the PKAcW196G proximity proteome. Gray dots indicate proteins with a corrected P value lower than 0.05. Colored dots indicate RII-selective (teal) and RI-recruiting (yellow) complex components. Data from four biological replicates. (E) STRING network depiction of proteins with increased PKAcW196G association versus WT PKAc. (F) Selected gene ontology cell component enrichment scores for highly disparate categories between WT PKAc (gray) and PKAc-W196G (green). (G) Left: PKAc-W196G gene ontology enrichment for major cell compartments and organelles relative to WT PKAc. Right: Schematic depiction of results in a prototypic cell. (H) PKAc-W196G association with PKA regulatory components relative to WT PKAc. (I) PKAc-W196G association with AKAPs relative to WT PKAc. Colors indicate likely RII-selective (teal) and RI-recruiting (yellow) AKAPs.

