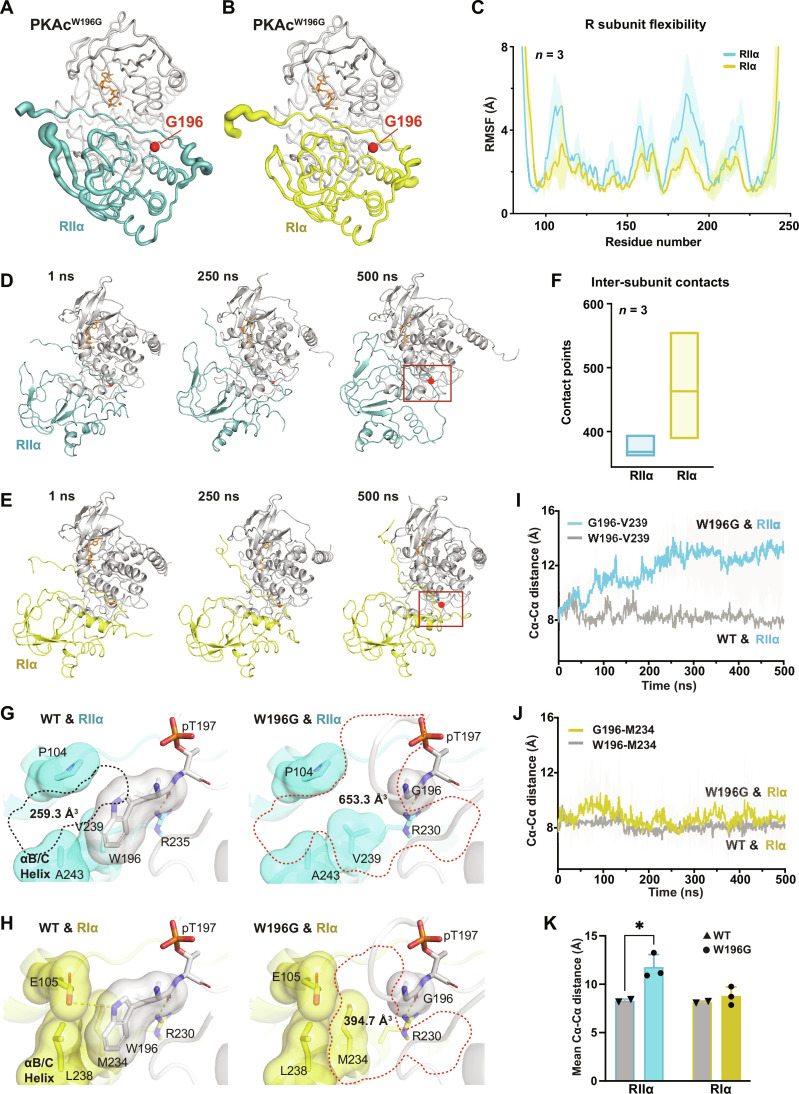
Fig. 4. A mechanistic explanation for R selectivity of PKAcW196G.
(A and B) B-factor putty diagram of PKAcW196G complexed with RIIα (A) or RIα (B). Thicker lines represent higher fluctuations. ATP and magnesium ions are shown in orange. (C) Plot showing the root mean square fluctuation (RMSF) values of RIIα (teal) and RIα (yellow) subunits plotted against residue number when complexed with PKAcW196G. Fluctuations were calculated for Cα atoms over the entire trajectory. Means ± SD; n = 3 independent simulations. (D and E) Molecular dynamics (MD) time-course montages for PKAcW196G complexed with RIIα (D) and RIα (E). Red dot indicates glycine-196. Box indicates regions expanded and featured in (G) and (H). (F) Box plot showing the total number of contacts made during the 500-ns simulation between PKAc-W196G and each regulatory subunit. PyContact was used to calculate the total number of contacts. n = 3 independent simulations. (G and H) Cavities (dotted lines) at the interface between PKA catalytic and either RIIα (G) or RIα (H) regulatory subunits. Key residues at interfaces are shown as both sticks and surface representations. Polar contacts are indicated by yellow dashed lines. Cavity volumes were calculated using F pocket version 3.0. Representative of three independent replicates. (I) Plot of the Cα-Cα distance between V239 in RIIα and residue 196 in PKAc variants. PKAcW196G (teal; n = 3) experiences much greater displacement from RIIα than does the WT kinase (gray; n = 2) over 500-ns simulations. Means ± SD. (J) Plot of the Cα-Cα distance between M234 in RIα and residue 196 in PKAc variants. PKAcW196G (yellow; n = 3) experiences the same displacement as the WT kinase (gray; n = 2) over 500-ns simulations. (K) Bar graph of the 500-ns time points from (I) and (J). Means ± SE. *P ≤ 0.05, Student’s t test.

