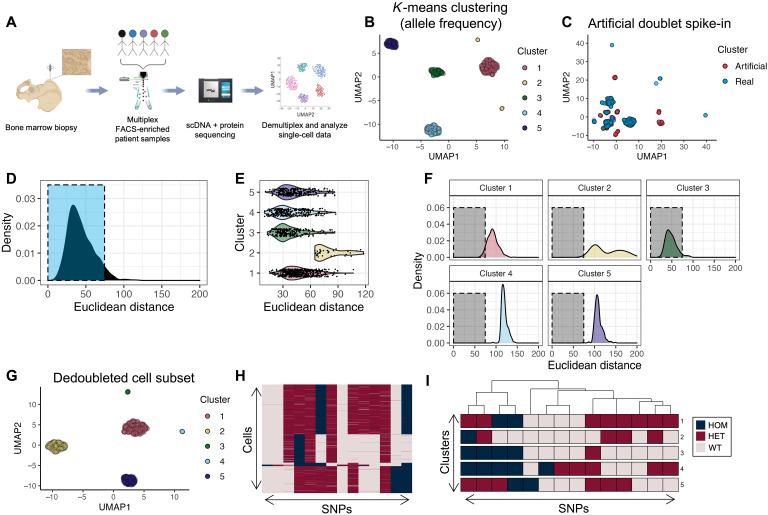
Fig. 2. Workflow and computational demultiplexing of scMRD data.
(A) Schema of scMRD workflow (generated via BioRender). (B) Predoublet exclusion K-means clustering and UMAP analysis of SNP allele frequencies in cells perfectly genotyped for the top 14 SNPs. (C) UMAP plot showing the results of clustering real cells (blue) with artificial doublets (red). (D) Distribution of Euclidean distances from real cells to their respective cluster centers. (E) Violin plot showing by-cluster Euclidean distances of each real cell to the respective cluster center. (F) By-cluster Euclidean distances of each real cell to an artificial doublet cluster center. (G) Postdoublet exclusion K-means clustering and UMAP analysis of SNP allele frequencies. (H) Heatmap showing SNP genotypes in singlet clusters. (I) Heatmap showing the most common SNP profile for each cluster. (B) to (I) show a representative example (MRD5) of the computational pipeline output. UMAP, uniform manifold approximation and projection; HOM, homozygous; HET, heterozygous; WT, wild-type.

