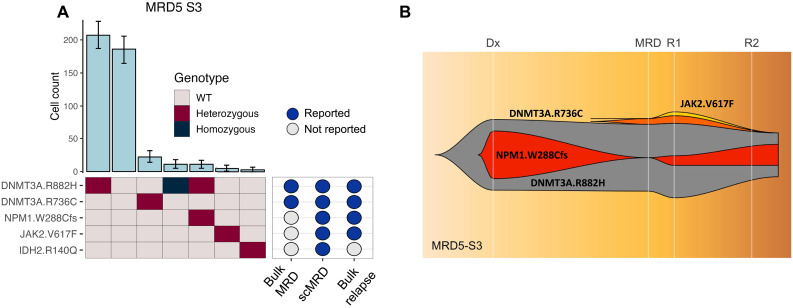
Fig. 4. Clonal analysis of MRD5-S3.
(A) Clonal barplot of a patient (MRD5-S3) illustrating scMRD-specific detection of NPM1 and JAK2 mutations that were present at relapse. (B) Fish plot showing clonal evolution based on bulk NGS at diagnosis, remission (6 month after diagnosis), relapse time point 1 (R1; 7 months after diagnosis), and relapse time point 2 (R2; 11 months after diagnosis).

