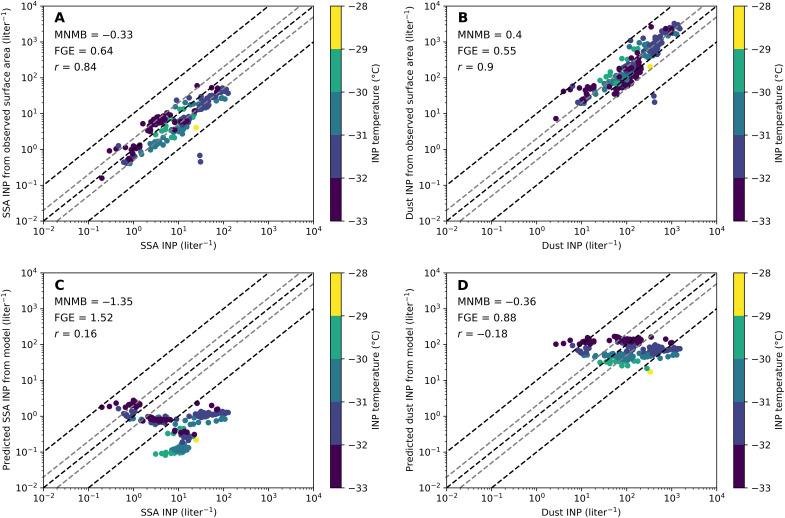
Fig. 2. Scatter plots of predictions of speciated INPs, on the basis of parameterizations and aerosol measurements, versus speciated INPs based on residual experiments.
Marker color shows the temperature at which the measurement was collected. The top panels show relatively good agreement between speciated INPs predicted from aerosol size distributions for SSA (A) and dust (B). The bottom panels show the speciated INPs versus those predicted from simulations for SSA (C) and dust (D). MNMB, fractional gross error (FGE), and r are shown for each plot.

