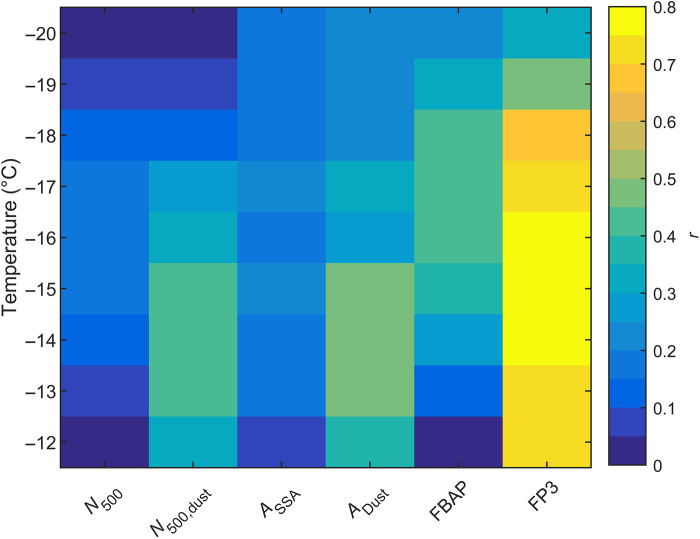
Fig. 3. Heatmap showing the Pearson correlation coefficients (r) between INP concentrations and aerosol observations.
N500 is the total number concentration of particles larger than 0.5 μm, N500,dust is the number concentration of dust particles larger than 0.5 μm, ASSA and ADust are the total particle surface area concentrations for SSA and dust, respectively, while FBAP (total fluorescent biological aerosol particles) and FP3 are the particle class concentrations measured by the WIBS.

