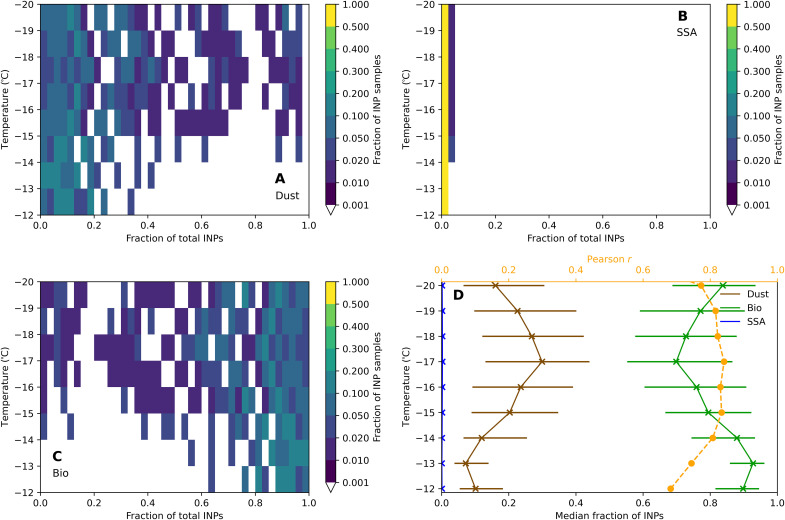
Fig. 4. Heatmaps of the fraction of speciated INPs as a function of temperature.
Panels show the fraction for (A) dust, (B) SSA, and (C) bio-INPs (Bio). Figure shading shows the fraction of INP samples between the upper and lower bounds of that bin, where brighter (darker) colors indicate bins with higher (lower) frequency of occurrence of that species’s fractional contribution (x axis) at a given temperature (y axis). (D) Median estimated fraction of INPs from dust (brown), SSA (blue), and bio-INPs (green). The horizontal bars show the interquartile ranges. The Pearson correlation coefficient r for the fit between the total speciated INPs and measured INPs is also shown.

