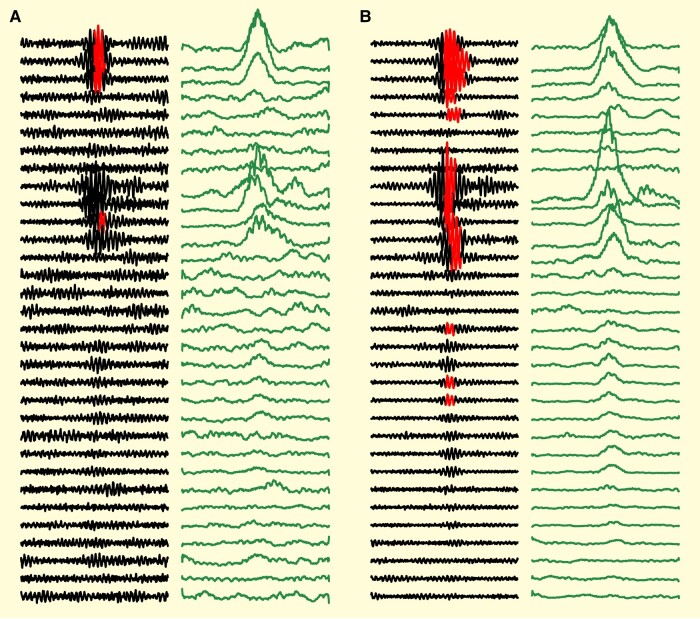
Figure 2.
Data analysis examples. Filtred (80–500 Hz) EEG (black) with superimposed HFO detections (red overlay) show how neighbouring channels often had high frequency discharges that did not cross threshold for the HFO detector but were still part of the network spread. In order to remove the effect of oscillatory phase and standardize the time of onset, cross-correlation analysis was performed on the root-mean-squared filtered data (green panels to right). (A) ‘Sample’ with a network discharge that had detected HFOs in three channels, but likely involved at least seven. Note that even in detected channels, the red detection does not accurately detect the onset/offset time of the true discharge. (B) Sample showing network HFO discharge over several channels simultaneously with varying amplitudes.

