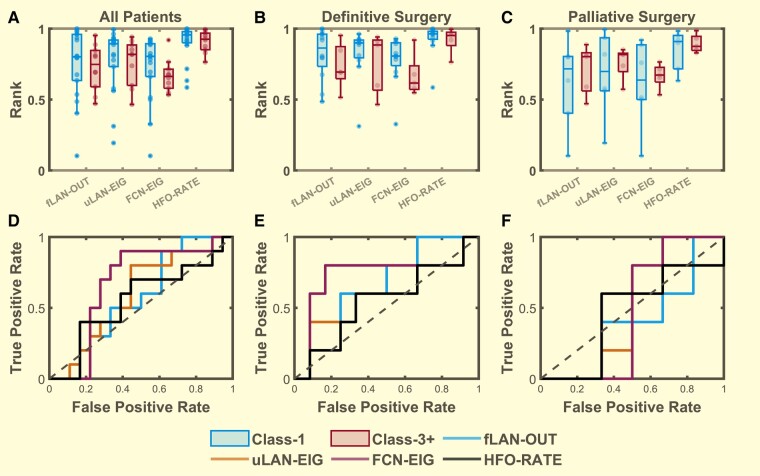
Figure 4.
Distribution of the top 50% highest seizure onset zone (SOZ50) mean centrality ranks. Comparison between Class 1 (blue, n = 18) and Class 3+ (red, n = 10) for (A) all patients, (B) definitive surgery patients (n = 12,5), (C) palliative surgery patients (n = 6,5) with SOZ50 computed for the outcloseness centrality (fLAN-OUT) of the forward propagating network, eigenvector centrality (uLAN-EIG) of the undirected lag asymmetry network, eigenvector centrality (FCN-EIG) of the FCN, and the ranked HFO rate (HFO-RATE). While it seems that the mean SOZ centrality ranks and ranked HFO rates (HFO-RATE) are generally higher in class-1 definitive surgery group compared to that of the class-3+ group there was no statistical significance detected for group differences for each stratified patient sets (all patients, definitive surgery and palliative surgery) (Hotelling’s T2 P = 0.914, 0.227, 0.966; T2 = 0.975, 5.652, 0.572; n = 28, 17, 11, respectively). (D–F) The ROC curves were used to demonstrate the effect size for each feature in distinguishing between class-1 and class-3+ for each respective stratified patient sets (A–C). Boxes represent the interquartile range with the horizontal line being the median and whiskers extending 1.5 times the interquartile range. Jittered data points are overlaid on top of the box plots.

