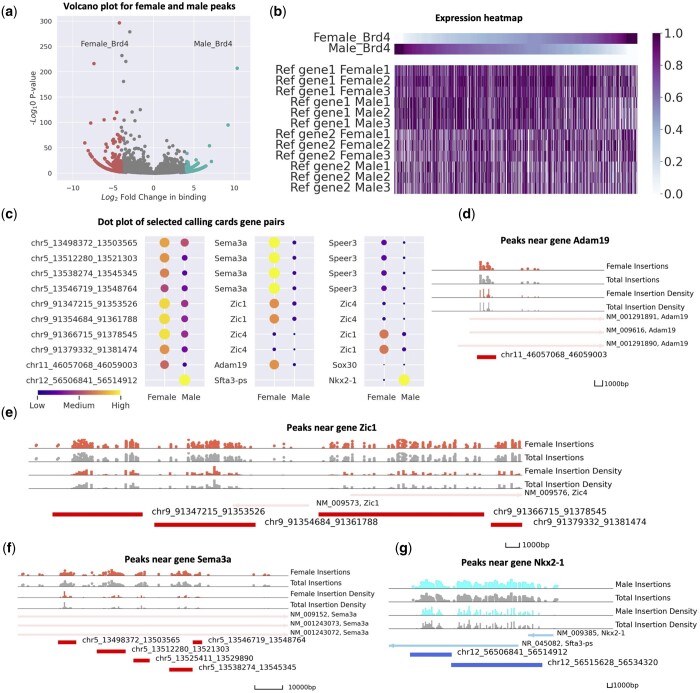
Figure 4.
Application of Pycallingcards to bulk glioblastoma CC data. (a) Volcano plot for female and male peaks. The dots on the left-hand side indicate peaks with more Brd4 binding in females and the dots on the right hand display more Brd4 binding in males. The x-axis is the log fold change and the y-axis is the log P-value. (b) Heatmap for calling cards and RNA-seq expression. The first two lines plot the relative Brd4 binding in males and females at differentially bound peaks. The following lines display the relative gene expression of the nearest (first six rows) and next-nearest (second six rows) genes. (c) Dot plot of selected calling cards gene pairs. (d–f) Peaks near gene Sema3a, Adam19, and Zic1. Red symbols and density plots represent Brd4 insertions and insertion density in females, whereas gray symbols and plots represent Brd4 binding in males. (g) Peaks near gene Nkx2-1. Blue symbols and density plots represent Brd4 insertions and insertion density in males, whereas gray symbols and plots represent Brd4 binding in females.

