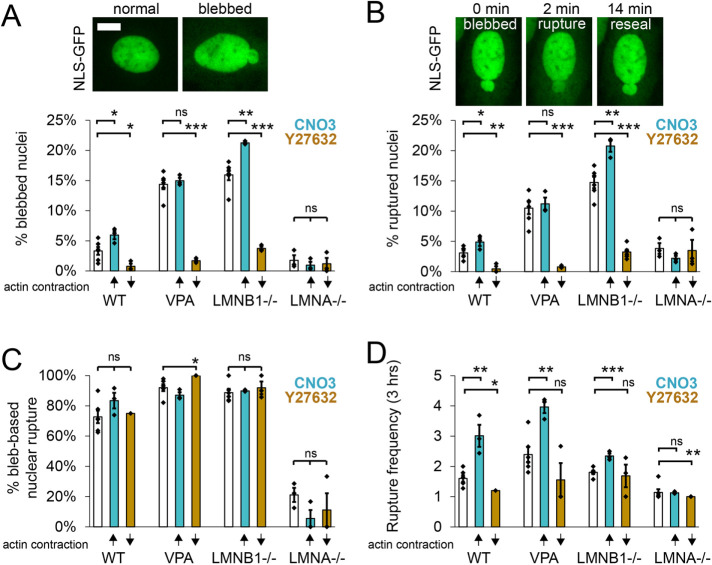
FIGURE 3:
Actin contraction controls nuclear blebbing and bleb-based ruptures. Example images of (A) normal and blebbed nuclei as well as (B) bleb-based nuclear rupture via NLS-GFP time lapse imaging. (A–D) Graphs showing the percentage of (A) blebbed nuclei, (B) nuclear ruptures, and (C) bleb-based ruptures along with (D) the number of ruptures (frequency) of a single nucleus that ruptures over 3 h imaged at 2-min intervals for WT, VPA, LMNB1−/−, and LMNA−/− without modulation (white bar), with increased actin contraction (turquoise bar, CN03), or with decreased actin contraction (gold bar, Y27632). Six biological replicates for unmodulated and three biological replicates for increased or decreased actin contraction, experiments represented by black dots, n = 75–400 cells each experiment. Student’s t test p values reported as * < 0.05, ** < 0.01, *** < 0.001, or ns denotes no significance, p > 0.05. Error bars represent standard error. Scale bar = 10 µm.

