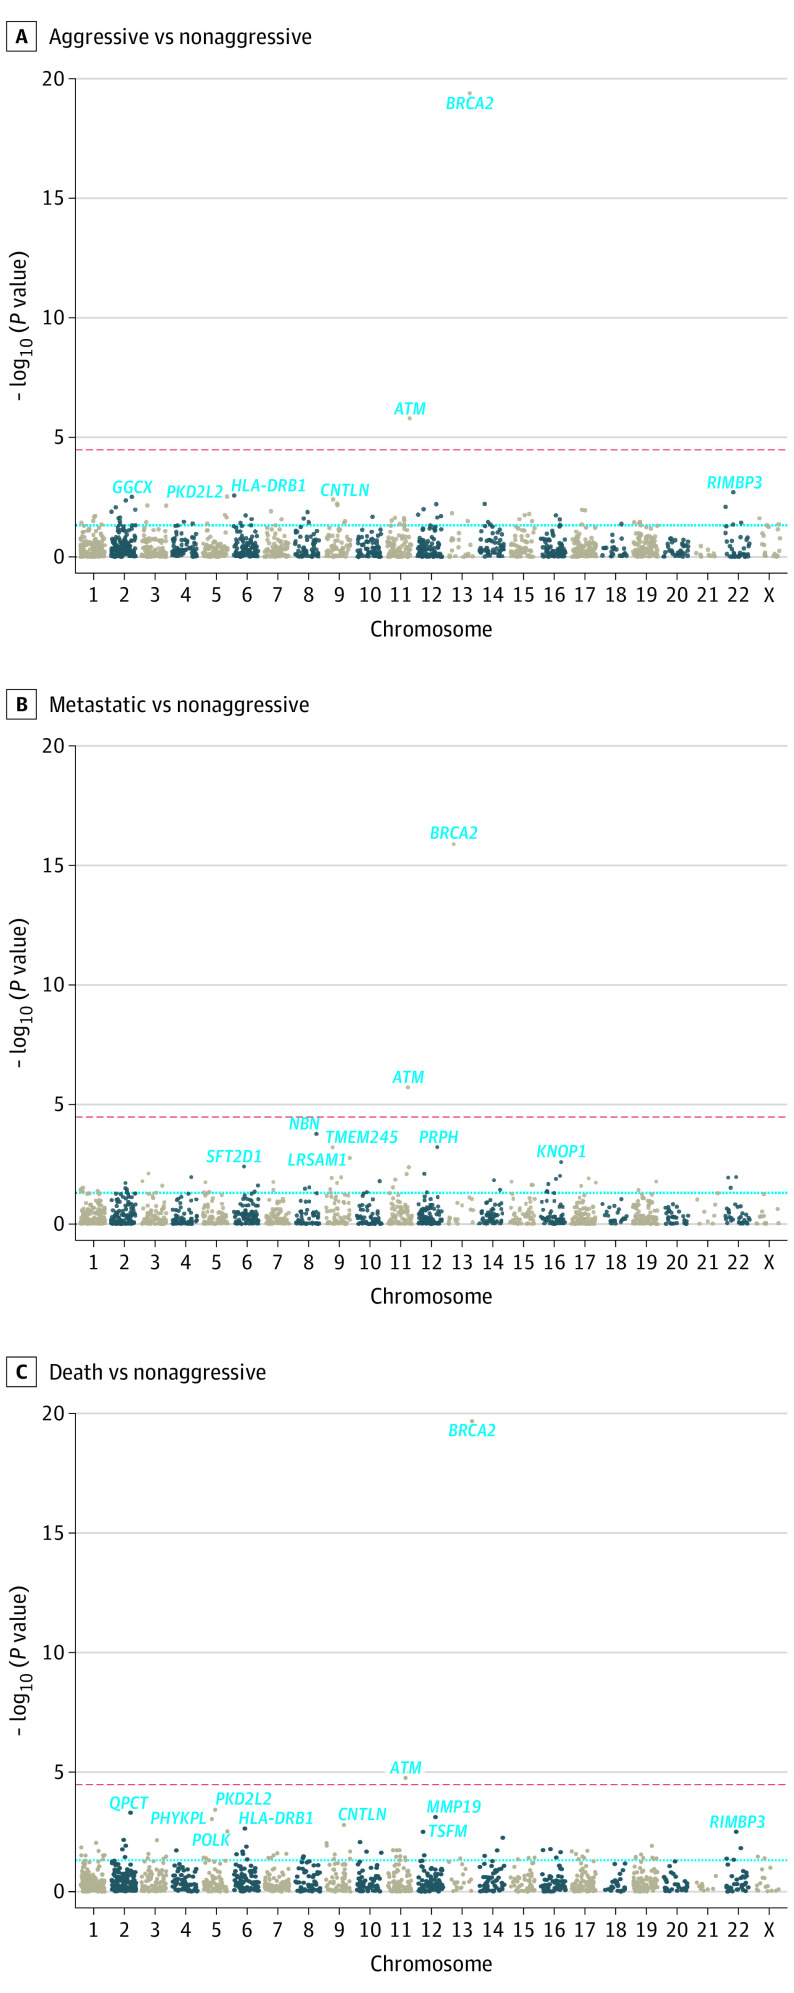
Figure 2. Exome-Wide Gene-Based Results Meta-Analyzed Across Stages 1 and 2 by Prostate Cancer (PCa) Outcome.
A, With 87 of 1460 (6.0%) tested genes having P < .05. B, With 62 of 1314 (4.7%) tested genes having P < .05. C, With 93 of 1422 (6.5%) tested genes having P < .05. The red dashed line indicates a Bonferroni-adjusted significance threshold; the blue dashed line indicates P = .05.

