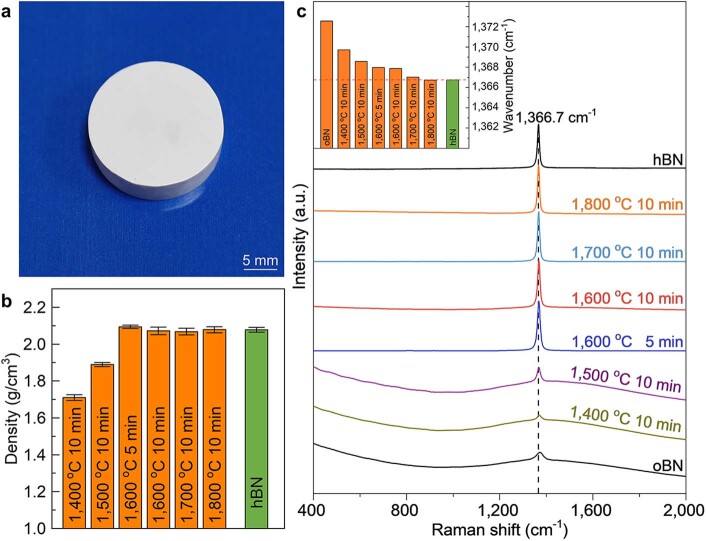
Extended Data Fig. 1. Density and Raman spectra of ceramics prepared by SPS sintering oBN under different conditions.
a, Optical photo of the as-prepared ceramic block. b, Densities of sintered ceramics. Orange and green columns represent the ceramics prepared from oBN and hBN nanoprecursors, respectively. The sintering pressure was fixed at 50 MPa, and the sintering temperature and holding time were different, as shown in the figure. Error bars represent 1 s.d. (n = 5). c, Raman spectra obtained from various samples. With increasing sintering temperature, the E2g band of the as-prepared ceramics shifts toward low wavenumbers, approaching that of hBN. Inset compares the shift magnitude of this Raman band in wavenumber.

