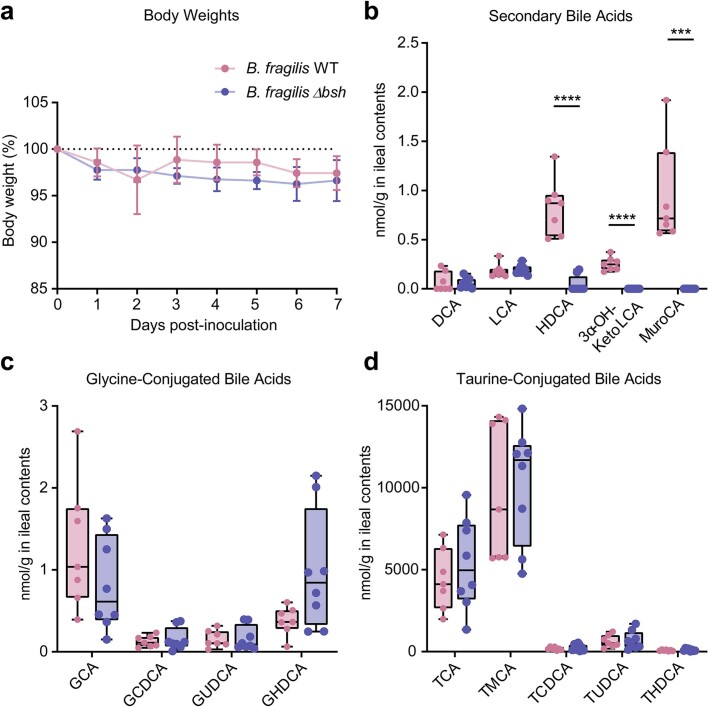
Extended Data Fig. 5. Body weights and ileal bile acid concentrations in B. fragilis monocolonized mice.
(a) Body weights relative to weight at inoculation on day 0. Data are presented as mean values ± SD. Ileal concentrations of (b) secondary, (c) glycine-conjugated, and (d) taurine-conjugated bile acids. Significant differences were determined by two-tailed t-test between WT (pink) and Δbsh (blue) colonized mice (HDCA p = 5.2e-6****, 3αOH-KetoLCA p = 1.1e-7****, MuroCA p = 1.4e-4***). For (b-d), the bounds of the box plots represent Q1–Q3 with median as center and min-max values for whiskers. Biological replicates were n = 7 for WT and n = 8 for Δbsh.

