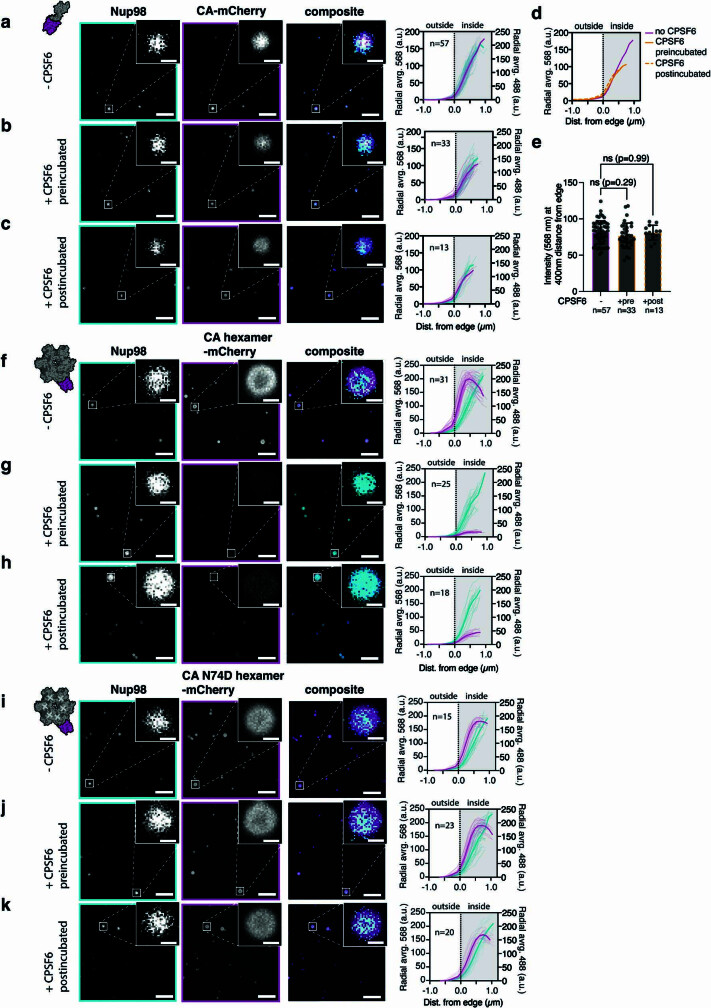
Extended Data Fig. 7. Confocal fluorescence microscopy (all channels) of Nup98 condensates and CA-mCherry, CAhexamer-mCherry or CA (N74D)hexamer-mCherry in the presence of CPSF6.
a-c, Single z-plane images (cyan, 488-Nup channel; magenta, protein-mCherry channel) of CA-mCherry without CPSF6 (a), with CPSF6 pre-incubated for 10 min (b), with CPSF6 post-incubated 20 min (c). d, Background subtracted radially averaged fluorescence intensity across condensates for 488-Nup channel (cyan) and protein-mCherry channel (magenta). Mean intensity curves shown in bold. Scale bar 5 µm (main), 1 µm (inset). e, Intensity values (568) at 400 nm from edge of condensates. f-k, Single z-plane images (cyan, 488-Nup channel; magenta, protein-mCherry channel) of CAhexamer-mCherry (f) or CA (N74D)hexamer-mCherry (l) without CPSF6, with CPSF6 pre-incubated 10 min (g and j), with CPSF6 post-incubated 20 min (h and k). Background subtracted radially averaged fluorescence intensity across condensates for 488-Nup channel (cyan) and protein-mCherry channel (magenta). Mean intensity curves shown in bold. Scale bar 5 µm (main), 1 µm (inset). N = number of condensates analysed per sample. Error bars show standard deviation of the mean. Statistical test for panel e is one-way ANOVA.

