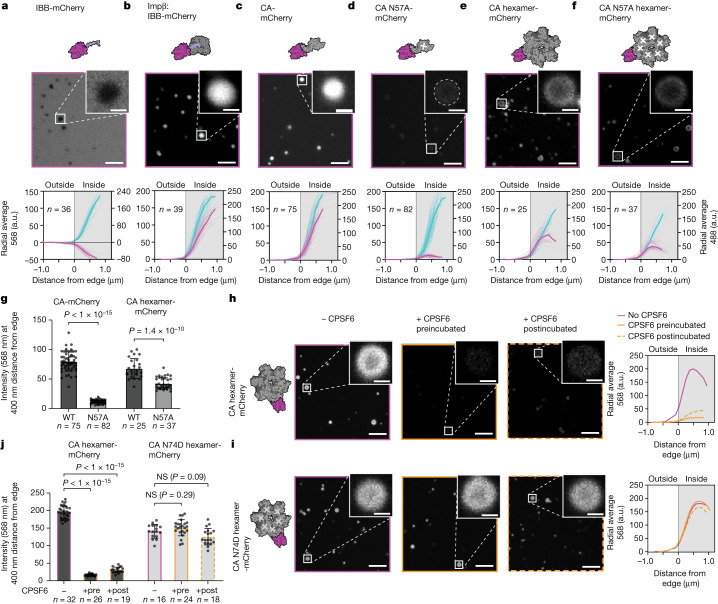
Fig. 3. The FG-binding pocket mediates HIV-1 CA entry into Nup98 condensates.
a–f, Single z-plane images (568 nm) of mCherry-labelled controls or CA constructs (top) and background-subtracted radially averaged fluorescence intensity condensate depth profiles (bottom; cyan, Nup98 channel; magenta, protein-mCherry channel): IBB-mCherry (a), Impβ:IBB-mCherry (b), CA-mCherry (c), CA N57A-mCherry (d), CA hexamer-mCherry (e), CA N57A hexamer-mCherry (f). Mean intensity curves are shown in bold. g, Intensity values (568 nm) for CA-mCherry and CAhexamer-mCherry WT and N57A at 400 nm from the condensate edge. h,i, Single z-plane images (568 nm) for CAhexamer-mCherry (h) and CA N74Dhexamer-mCherry (i) in the absence of CPSF6 (magenta), preincubated with CPSF6 (orange) or postincubated with CPSF6 (dashed orange). Mean fluorescence intensity depth profiles are shown for all conditions. j, Intensity values for CAhexamer-mCherry and CA N74Dhexamer-mCherry in the absence and presence of CPSF6 at 400 nm from the condensate edge. All images: scale bar for main, 5 µm; scale bar for inset, 1 µm. n, number of condensates analysed per sample. Error bars show the standard deviation of the mean. Statistical tests: two-tailed t-test (g) and one-way analysis of variance (j). Impβ, importin-β.

