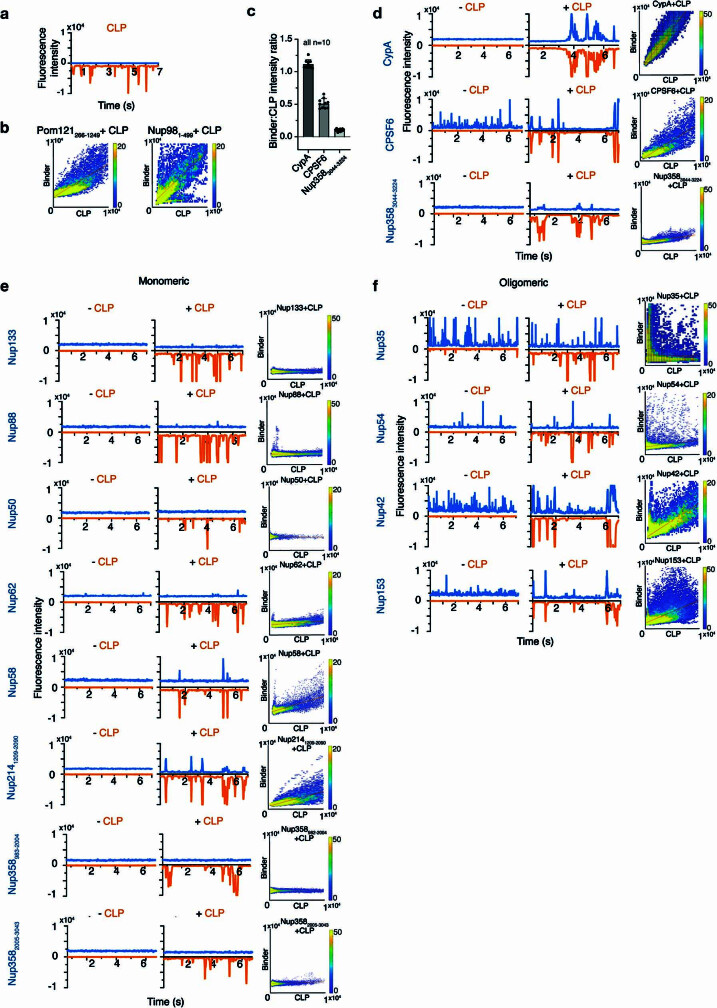
Extended Data Fig. 2. FFS data for CLPs and interactors.
a, FFS trace of AF568-CLP (orange). b, Coincidence heatmaps used to calculate NUP:CLP fluorescence intensity ratios for Pom121 and Nup98 (Fig. 1c and d). Representative FFS traces are shown in Fig. 1a and b. d, e and f, FFS traces for GFP-binders in the absence and presence of AF568-CLP and heat maps of binder to CLP fluorescence intensity used to calculate fluorescence intensity ratios in c, and Fig. 1c and d. Blue, Nup channel; orange, CLP channel. Error bars show standard deviation of the mean. N=number of scans per sample.

