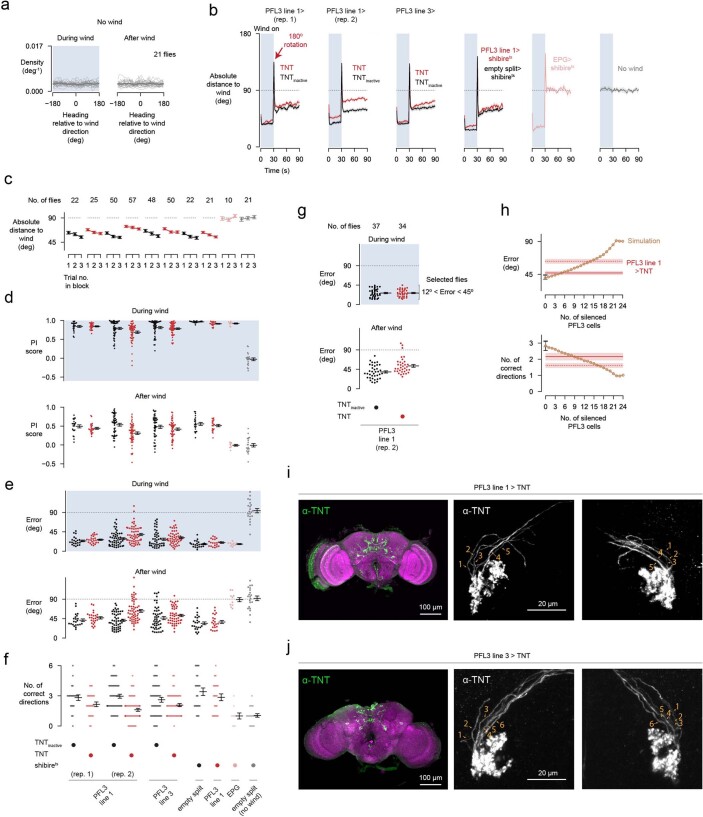
Extended Data Fig. 11. Additional analyses of data relevant for the wind-induced angular memory task.
a, Probability distribution of heading relative to wind direction from control flies (empty split > shibirets) in which in the airflow was set to a zero flow rate during the period in which wind would normally be on (left) and during the test period (right). b, First column: absolute angular difference between heading and wind direction over time for flies expressing TNT (red) and TNTinactive (black) in cells targeted by PFL3 line 1 (57C10-AD ∩ VT037220-DBD). Data shown are from the first experimental replicate. Mean ± s.e.m. across flies is shown. Only the second and third trial of each wind block were analyzed. Second column: same as the first column but for the second experimental replicate from PFL3 line 1. Third through sixth column: PFL3 line 3 (27E08-AD ∩ VT037220-DBD) > TNT vs. PFL3 line 3 > TNTinactive, PFL3 line 1 > shibirets vs. empty split > shibirets flies, EPG > shibirets flies and empty split-Gal4 > shibirets flies in which the airflow was turned off. c, Mean absolute distance between heading and wind angles during the test period as a function of the trial number within a block for each group. Mean ± s.e.m. across flies. d, Performance index (PI) during the wind period (top) and during the test period (bottom) (See Methods for definition of PI). Each dot shows the mean for a fly across all wind directions. Mean ± s.e.m. across flies is indicated. e, Wind-direction error (error) during the wind period (top) and during the test period (bottom). Each dot shows the mean for a fly across all wind directions. Mean ± s.e.m. across flies is indicated. f, Number of wind directions that each fly correctly oriented along. Each dot represents one fly. Mean ± s.e.m. across flies is indicated. In panels e and f, columns one through four, and columns eight through ten, are re-plotted from Fig. 6. g, PFL3 line 1 > TNT flies (rep. 2) had a greater wind-direction error during the wind period than control flies (p = 3.15 × 10⁻³, compare columns two and three of the top row of panel e). To test whether their poorer performance during wind-on period could explain the poorer performance during the test period, we plot the wind-direction error during the wind period (top) and during the test period (bottom) as in panel e, but after selecting for flies whose mean error during the wind period was between 12° and 45°. That the selected PFL3 line 1 > TNT flies still show a greater wind-direction error during the test period than their respective control flies (p = 6.47 × 10⁻⁴) argues that the poorer performance of these flies was not simply due to a lower motivational drive or a reduced ability to orient upwind when the wind was on. Mean ± s.e.m. across flies is indicated. h, Top: model simulation of the effect of silencing increasing number of PFL3 cells on the average absolute wind-direction error (orange dots). Error bars at x = 0 shows the s.e.m. range for PFL3 line 1 > TNTinactive control flies (rep. 1: black, n = 22; rep. 2: grey, n = 50). The two red horizontal lines and shaded areas show the mean ± s.e.m. of the absolute wind-direction error for the two PFL3 line 1 > TNT replicates we tested (rep. 1: solid line, n = 25; rep. 2: dotted line, n = 57). Bottom: same as top but for the number of correct goal directions. i, First column: whole-brain anti-TNT stain (green) and anti-Bruchpilot neuropil stain (magenta) from a PFL3 line 1 > TNT fly. Second and third columns show anti-TNT labeling in the left and right lateral accessory lobes (LAL). We estimated the number of PFL3 neurons that were targeted by manually counting the number of LAL-projecting neurites (see Methods). j, Same as in panel i but for PFL3 line 3.

