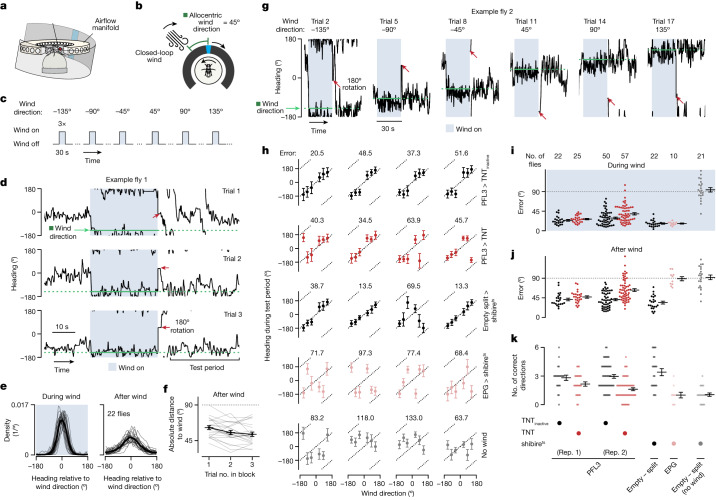
Fig. 6. Flies expressing a synaptic blocker in subsets of PFL3 cells have a reduced ability to navigate along remembered goal directions in a wind-induced angular memory task.
a, Setup for delivering airflow and visual stimuli in closed loop. A circular manifold of 36 equally spaced tubes delivers airflow to the head-fixed fly from different directions. b, To simulate the experience of a fixed allocentric wind direction, the airflow angle changed in rotational closed loop with the flies’ turns on the ball. The airflow angle had a fixed angular offset to the bar, which also rotated in closed loop. c, Task structure. d, Heading over time for the first three trials in a control fly (empty split-Gal4>shibirets). The upwind heading is indicated by the green dotted line. Red arrows indicate 180° virtual rotations of the fly (bar jumps) after the airflow is turned off. e, Heading relative to wind distributions from control flies (empty split-Gal4>shibirets) when the wind is on (left) and when the wind is off, during the test period (right). Thin lines represent individual flies. The thick line shows the mean across flies. f, Mean absolute distance between heading and wind angles during the test period as a function of the trial number within a block. Grey lines, mean of individual control flies (empty split-Gal4>shibirets). Black line shows mean ± s.e.m across flies (n = 22). g, Second trial of each wind-direction block from an example control fly (empty split-Gal4>shibirets). Red arrows indicate 180° rotation. h, Top row, mean heading direction during the test period versus the wind direction for four example control flies (PFL3>TNTinactive). TNTinactive denotes expression of a mutationally inactive TNT. Each dot represents the fly’s mean heading in the second and third trials of each wind-direction block. We refer to the absolute difference between this value and the wind direction as the wind-direction error (error). For each fly, the mean error across all six wind directions is indicated above each plot. Data shown as mean ± s.d. in heading across the second and third trials of each block. Bottom four rows show example flies for each of the following genotypes: PFL3>TNT, empty split-Gal4>shibirets, EPG>shibirets, and empty split-Gal4>shibirets flies for which the airflow was turned off. i, Error during the wind period for each group. For PFL3>TNT and PFL3>TNTinactive groups, we ran two independent replicates, shown separately. Each dot shows the mean for a fly across all wind directions. Mean ± s.e.m. across flies is indicated for each genotype. j, Same as i but for the test period. PFL3>TNT flies exhibited a greater error than PFL3>TNTinactive flies (P = 0.05 for replicate (rep.) 1 and P = 1.20 × 10⁻⁶ for replicate 2, two-sided Mann–Whitney U-test; combined P value = 1.08 × 10⁻⁶, Fisher’s method). k, Number of wind directions that each fly correctly oriented along. Each dot represents one fly. Mean ± s.e.m. across flies is indicated. PFL3>TNT flies oriented along fewer correct directions than PFL3>TNTinactive flies (P = 0.04 for replicate 1 and P = 5.25 × 10⁻⁷ for replicate 2, two-sided Mann–Whitney U-test; combined P value = 3.90 × 10⁻⁷, Fisher’s method). PFL3 data are from the 57C10-AD ∩ VT0372202-DBD split-Gal4 line (PFL3 line 1).

