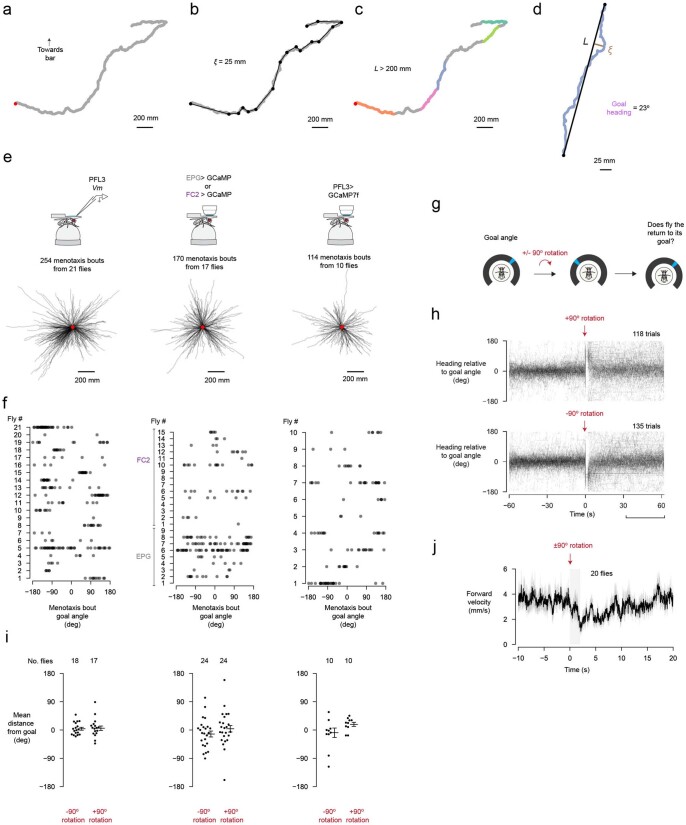
Extended Data Fig. 2. Using the fly’s virtual 2D trajectory to analyze menotaxis behaviour; and following a virtual rotation, flies slow down and turn so as to return to their previous heading.
a, Example virtual 2D trajectory of a fly performing menotaxis (during a PFL3 patch-clamp recording). Red dot marks the start of the trajectory. b, Ramer-Douglas-Peucker algorithm reduces the number of x,y coordinates in the trajectory using the parameter ξ, the maximum allowed distance between the simplified and original trajectories. Black dots show the simplified coordinates. c, The fly’s displacement between each x,y point of the simplified trajectory, L, is computed. Segments of the fly’s trajectory where L > 200 mm were considered “menotaxis bouts” and thus further analyzed (colored portions of the trajectory). d, An example menotaxis bout from the trajectory in panel c. The fly’s goal angle is defined as the fly’s mean heading direction during the bout, excluding timepoints when the fly is standing still. e, All menotaxis bouts from flies used in this paper. First column: PFL3 patch-clamp dataset (related to Fig. 3). Middle column: EPG and FC2 imaging dataset (related to Fig. 1). Third column: PFL3 LAL imaging dataset (related to Fig. 5d). f, Goal angles for each menotaxis bout for each fly for datasets shown in panel e. g, To assess whether a fly was actively maintaining its heading direction, we virtually rotated the fly by discontinuously jumping the bar ±90° from its position immediately before the jump. The bar remained static at its new position for 2 s and then the fly regained closed-loop control. h, The fly’s heading relative to its goal angle for ±90° rotation trials from our PFL3 patch-clamp dataset. Only trials where the circular standard deviation of the fly’s heading direction during the 60 s prior to the bar jump was less than 45° (excluding timepoints when the fly was standing still) were analyzed here (55-74% of all trials were analyzed depending on the dataset). For this analysis, we defined the fly’s goal angle as its mean heading in the 60 s before the bar jump, excluding timepoints in which the fly was standing still. i, Mean heading relative to the fly’s goal angle during the 30 to 60 s after the bar jump for trials from each dataset shown in panels e-f. Each dot is the mean for an individual fly. Horizontal lines show mean ± s.e.m. across flies. j, Mean forward walking velocity around the time of bar jumps for trials shown in panel h. Shaded area marks the 2 s when the bar remained static. Mean ± s.e.m. across flies is shown.

