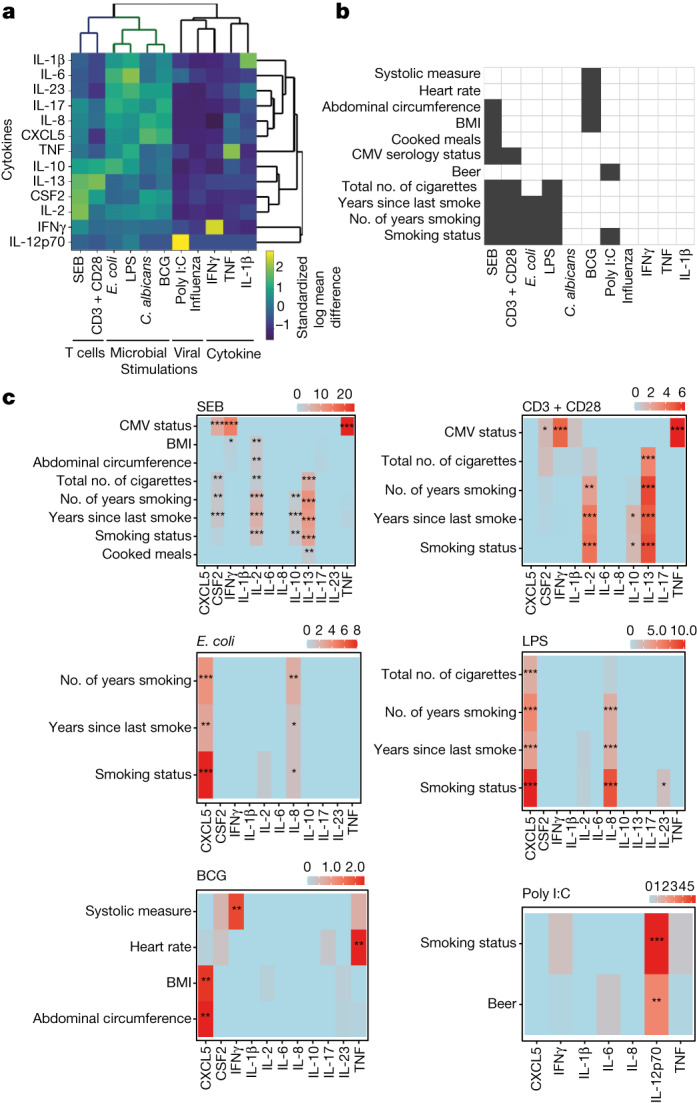
Fig. 1. Variables associated with cytokine levels in diverse immune stimulations.

a, Standardized log mean differences of 13 cytokines in 12 immune stimulations. b, Significant associations (Benjamini–Yekutieli adjusted P value of likelihood ratio test (LRT) < 0.01) of variables with at least one induced cytokine for each immune stimulation are coloured in black. c, Heat maps showing −log10(Benjamini–Yekutieli adjusted P value of LRT) for the eCRF variables associated with at least one cytokine in each stimulation (Benjamini–Yekutieli adjusted P value of LRT < 0.01). *P < 0.05, **P < 0.01, ***P < 0.001.
