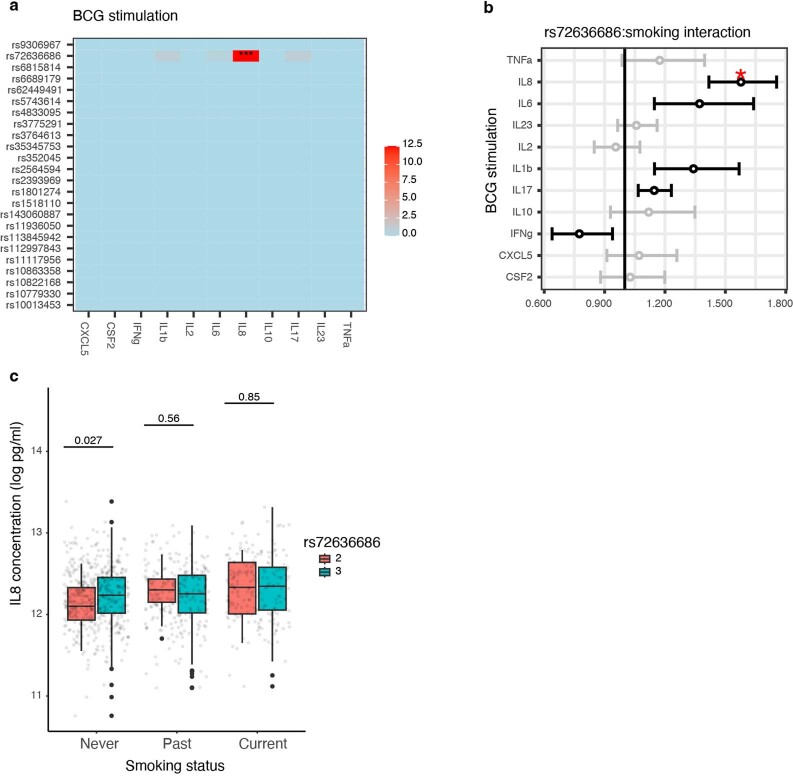
Extended Data Fig. 8. Smoking status and SNPs interactions.
a, Heatmaps showing -log10(BY adj.pval of likelihood ratio test) of interactions between genetic variants listed in Table 1 and smoking status for each induced cytokine following BCG stimulation considering age, sex and batchId as covariates. These are colored according to the color key on the side of the heatmap and stars are shown depending on the strength of association.*P < 0.05, **P <0.01, ***P < 0.001. b, Two-sided effect size plot made representing n = 955 independent individuals with 0.95 confidence interval for the interaction of the SNP rs72636686 with the smoking status, corrected for age, sex and batchId, on induced cytokines following BCG stimulation. Significant effect sizes (p-val < 0.01) are in black, others are in grey. Those that also have BY adj.pval of the likelihood ratio test <0.01 are labelled with a red star. c, Boxplot representing n = 955 independent individuals for IL8 levels depending on the genotype for rs72636686 and the smoking status. The centre line shows the median, hinges represent the 25th and 75th percentiles, and whiskers extend from the hinge to the largest or smallest value no further than the 1.5 interquartile range. Significance of two-sided Wilcoxon rank sum tests adjusting for multiple comparisons are indicated above the compared data.

