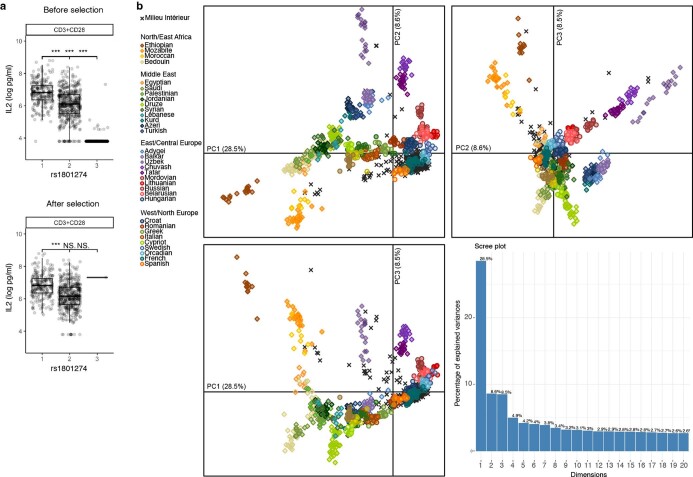
Extended Data Fig. 9. IL-2 protein levels depending on FcγRIIA polymorphism rs1801274 and genetic PCA showing homogeneity of the genetic background of Milieu Intérieur individuals.
a, Boxplots representing n = 1,000 independent individuals for IL-2 concentration levels depending on the genotype of the donors for the rs1801274 genetic variant before and after K-means clustering (2 groups) selection of responders. The centre line shows the median, hinges represent the 25th and 75th percentiles, and whiskers extend from the hinge to the largest or smallest value no further than the 1.5 interquartile range. Significance of two-sided Wilcoxon rank sum tests adjusting for multiple comparisons is indicated above the boxes (N.S, not significant; *P < 0.05, **P < 0.01, ***P < 0.001). P-values are from left to right on the top boxplot: <2.22e-16, <2.22e-16 and <2.22e-16 and on the bottom boxplot: <2.22e-16, 0.35 and 0.15. b, PCA performed on 261,827 independent SNPs and 1,723 individuals, which include the 1,000 MI donnors together with 723 individuals from a selection of 36 populations from North Africa, the Near East, as well as western and northern Europe. PC1 versus PC2 (top left), PC1 versus PC3 (bottom left) and PC2 versus PC3 (top right) are displayed as well as a barplot (bottom right) of the variance explained by the first 20 components of the PCA.

