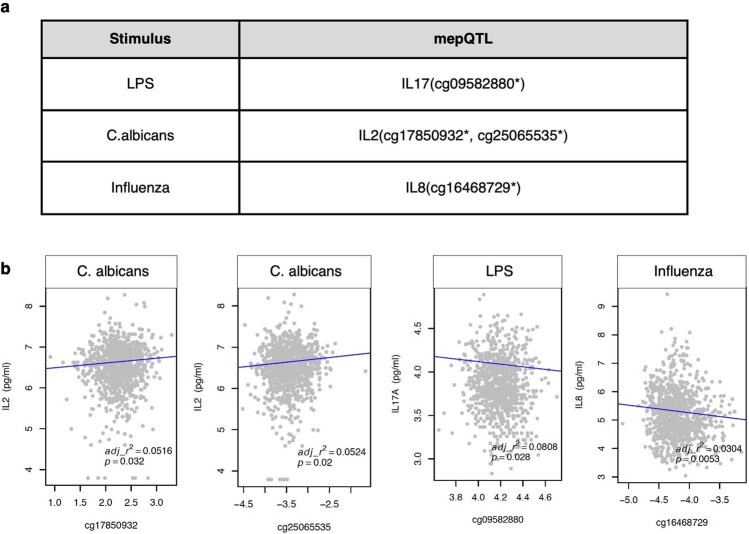
Extended Data Fig. 10. Association of DNA methylation probes with their cognate cytokines.
a, DNA methylation probes located within 1 Mb of the TSS of each cytokine that show associations (Benjamini-Hochberg false discovery rate adj-pval of likelihood ratio test <0.05) with the concentration levels of these cytokines in the specified stimulation condition (*P < 0.05). b, Plots showing the corresponding concentration levels depending on the methylation levels of the probes. Adj-r2 values of the linear regressions and p-statistics of two-sided Pearson correlations are reported on each graph.

