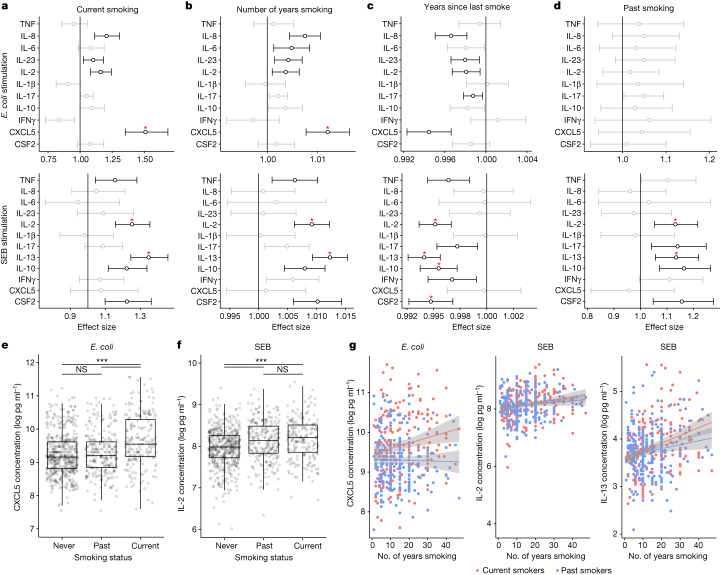
Fig. 2. Smoking effects on innate and adaptive immune responses, represented by E. coli and SEB stimulations, respectively.
a–d, Two-sided effect size plots representing effect on each induced cytokine using n = 955 independent individuals with 0.95 confidence interval for current smoking compared with non-smoking (a), for number of years smoking (b), for years since last smoke (c), and for past smoking (d) in E. coli or SEB stimulation. Significant effect sizes (P < 0.01) are in black, others are in grey. Those that also have Benjamini–Yekutieli adjusted P value of LRT < 0.01 are labelled with a red star. Exact P values are provided in the Source Data. e,f, CXCL5 concentration following E. coli stimulation (e) and IL-2 concentration following SEB stimulation (f) for never, past and current smokers. Box plots represent n = 955 independent individuals. The centre line shows the median, hinges represent the 25th and 75th percentiles and whiskers extend from the hinge to the largest or smallest values no further than 1.5 interquartile range. Two-sided Wilcoxon rank sum tests adjusting for multiple comparisons are shown. P values (left to right): 0.18, 7.3 × 10⁻¹² and 2.1 × 10⁻⁷ (e); 1.1 × 10⁻⁵, 1.3 × 10⁻⁷ and 0.32 (f). g, CXCL5 concentration following E. coli stimulation and IL-2 and IL-13 concentration following SEB stimulation versus numbers of years smoking for current or past smokers. Grey areas depict the 0.95 confidence intervals of the linear regression lines.

