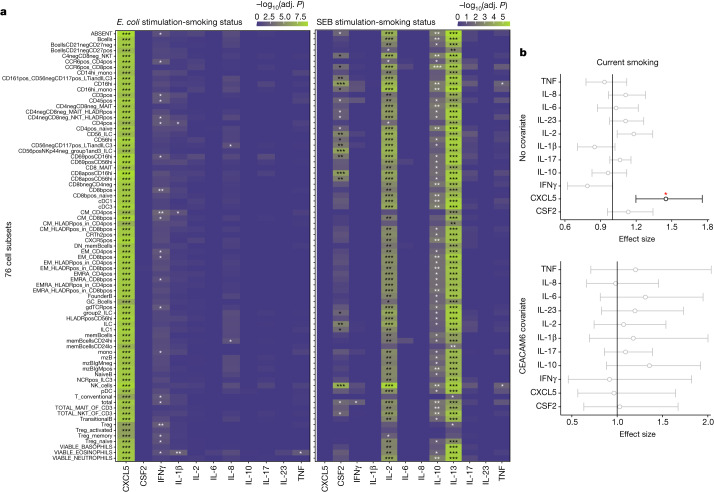
Fig. 3. Effects of smoking on induced cytokines is modified by blood cell subsets and plasma proteins.
a, Heat maps showing associations (−log10(Benjamini–Yekutieli adjusted P value of LRT (adj. P))) of the smoking status with induced cytokines in E. coli and SEB stimulations with either no cell subset count covariate (top line) or each of 76 cell subset counts passed as covariates in the models. b, Two-sided effect size plots representing n = 955 independent individuals with 0.95 confidence interval for current smokers compared with non-smokers in E. coli stimulation when no plasma protein (top) or CEACAM6 (bottom) is passed as a covariate in the models. Significant (P < 0.01) effect sizes are in black and others are in grey. The red star indicates a Benjamini–Yekutieli adjusted P value of LRT < 0.001.

