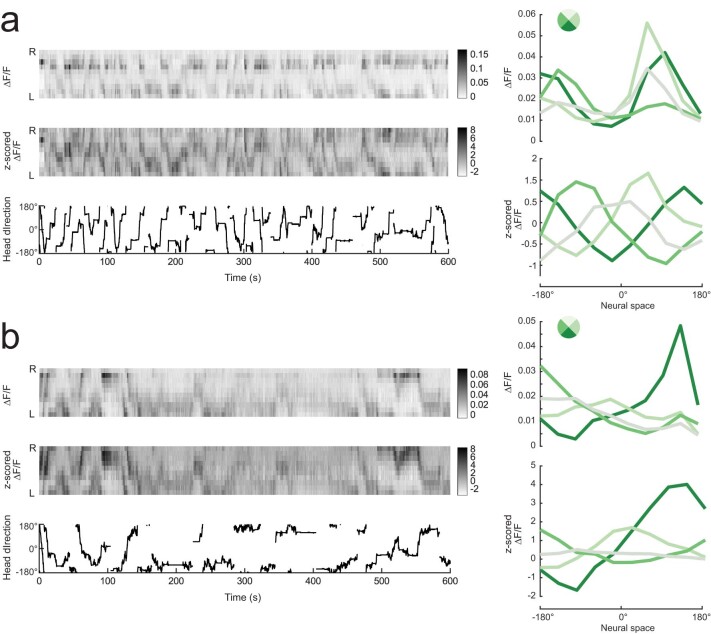
Extended Data Fig. 9. ∆F/F compared to z-scored ∆F/F.
a, Left: ∆F/F binned into 1-s increments across an entire 10-min trial for a fly that exhibited low goal fixation, before and after z-scoring, compared with head direction. Right: ∆F/F is divided into 4 bins based on the fly’s head direction relative to the head direction associated with the lowest PFL2 bump amplitude. This is done separately for raw ∆F/F (top) and z-scored ∆F/F (bottom). Here, z-scoring reduces but does not eliminate the difference in bump amplitude across bins. b, The same as (a) but for a fly that exhibited high goal fixation during the 10-min trial. Here, there is a strong variation in bump amplitude that persists across bins, even after z-scoring. These data are shown in Fig. 5j.

