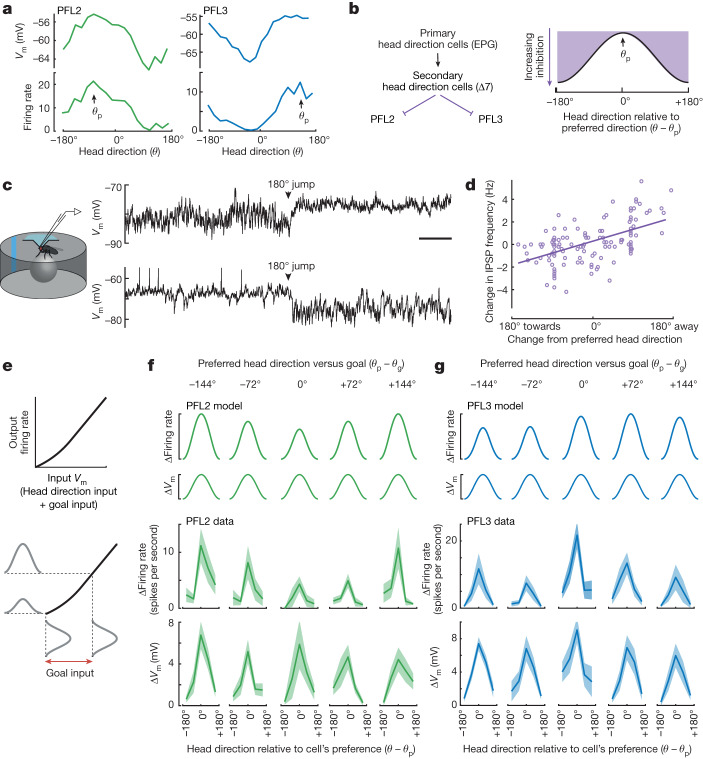
Fig. 4. Navigation dynamics at cellular resolution.
a, Head direction tuning in an example PFL2 cell and an example PFL3 cell. Preferred direction is θp. b, Each PFL2 and PFL3 cell is predicted to receive synaptic inhibition that varies sinusoidally with head direction. c, Whole-cell recordings from PFL2 and PFL3 cells showing changes in IPSP frequency when we impose a rotational jump on the virtual environment, emulating a change in θ. d, Change in IPSP frequency versus change in θ (relative to θp, mean ± s.e.m. across cells, n = 12 PFL3 and 10 PFL2 cells in 22 flies, Pearson’s r = 0.53). The effect of θ is significant (P = 8 × 10⁻³, two-way ANOVA, with θ and fly identity as the two factors). This analysis uses time points when the fly was standing still, because this makes individual IPSPs more clearly detectable. e, Model: a nonlinearity transforms Vm into firing rate for each model cell. Each cell receives head direction input that is cosine tuned to (θ − θp). The goal cell input to each cell represents a bias that does not change with head direction. This bias moves the cell’s input along the nonlinear function, changing the amplitude of the firing rate tuning curve. f, PFL2 cells are divided into bins based on (θp − θg). For each cell, we subtract the minimum y-axis value in the tuning curve, then we compute the mean of cells in the bin, for both firing rate and Vm. Model output (top) is compared with data (bottom, n = 11 cells, mean ± s.e.m. across cells). g, Same but for PFL3 neurons (n = 15 cells, mean ± s.e.m. across cells). Here we combine results from PFL3R and PFL3L (after reversing the left–right order of the five bins for the PFL3L cells, so that the model outputs are identical for R and L). Scale bar, 2 s.

