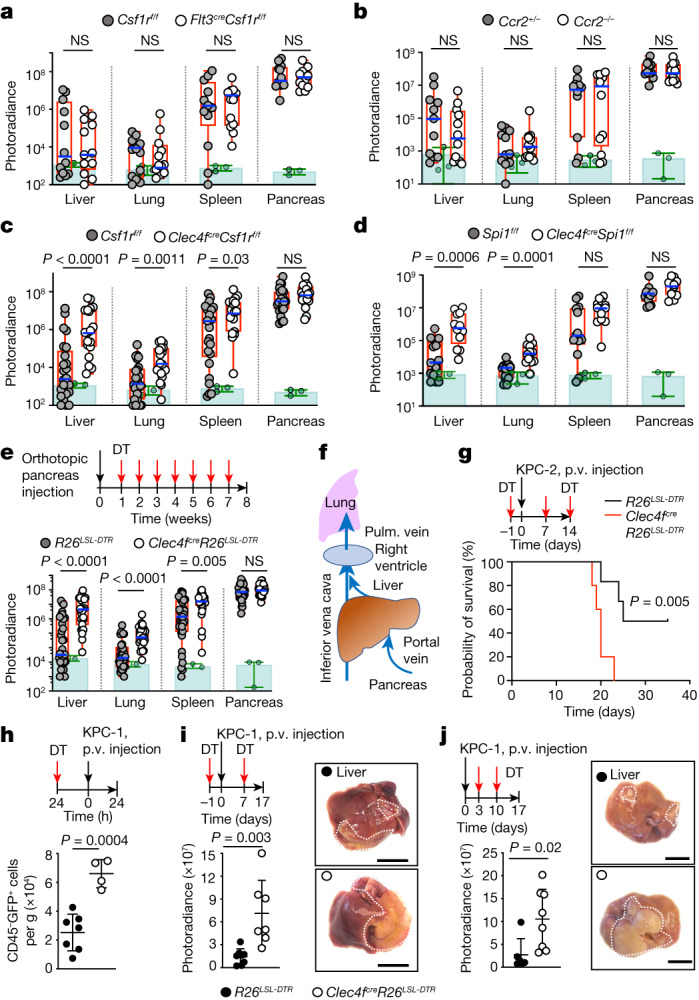
Fig. 1. KCs restrict tumour cell engraftment and metastasis.

a–e, Bioluminescence analysis of the tumour burden in the liver, lungs, spleen and pancreas of the indicated mice 8 weeks after orthotopic pancreas injection of 2 × 10⁵ KPC-2-luciferase (KPC-2-luci) cells: Flt3creCsf1rf/f mice (n = 12) and control Csf1rf/f littermates (n = 12) (a); Ccr2−/− mice (n = 12) and Ccr2+/− littermates (n = 11) (b); Clec4fcreCsf1rf/f mice (n = 19) and Csf1rf/f littermates (n = 25) (c); and Clec4fcreSpi1f/f mice (n = 12) and Spi1f/f littermates (n = 13) (d). Clec4fcreR26LSL-DTR mice (n = 26) and R26LSL-DTR littermates (n = 33) (e) received weekly intraperitoneal injection of DT (Methods) from week 1 to 7. The circles represent individual mice, boxes represent the 25–75% confidence intervals and the whiskers indicate the extreme values. The blue lines indicate the median. The green histograms represent the background bioluminescence imaging signal from wild-type C57BL/6J mice that did not receive tumours (n = 3 mice per group). Results are from at least three independent experiments per genotype. Statistical analysis was performed using two-tailed Mann–Whitney U-tests; P < 0.05 was considered to be significant. f, Schematic of pancreas venous drainage. Pulm., pulmonary. g, Clec4fcreR26LSL-DTR mice (n = 5) and R26LSL-DTR littermates (n = 6) received intraportal injection of 3 × 10⁵ KPC-2-luci cells (day 0 (D0)) and DT injections (D−1, D7 and D14). Survival was analysed using log-rank (Mantel–Cox) tests. p.v., portal vein. h, Clec4fcreR26LSL-DTR (n = 7) and R26LSL-DTR control (n = 4) mice received DT injection 24 h before intraportal injection of 1 × 10⁶ KPC-1-luci-GFP cells. The numbers of CD45−GFP+ tumour cells per g of liver were analysed 24 h later using flow cytometry. i, Clec4fcreR26LSL-DTR mice (n = 7) and R26LSL-DTR littermates (n = 8) received 1 × 10⁶ KPC-1-luci cells (D0) and DT injections (D−1 and D7), and the livers were analysed at D14 by bioluminescence imaging. Representative liver micrographs are shown on the right. j, Bioluminescence imaging analysis as described in i, with DT injections at D3 and D10 (n = 8 and 6). The circles represent individual mice. Data are mean ± s.d. Statistical analysis was performed using two-tailed unpaired t-tests; P < 0.05 was considered to be significant. For i and j, scale bars, 1 cm.
