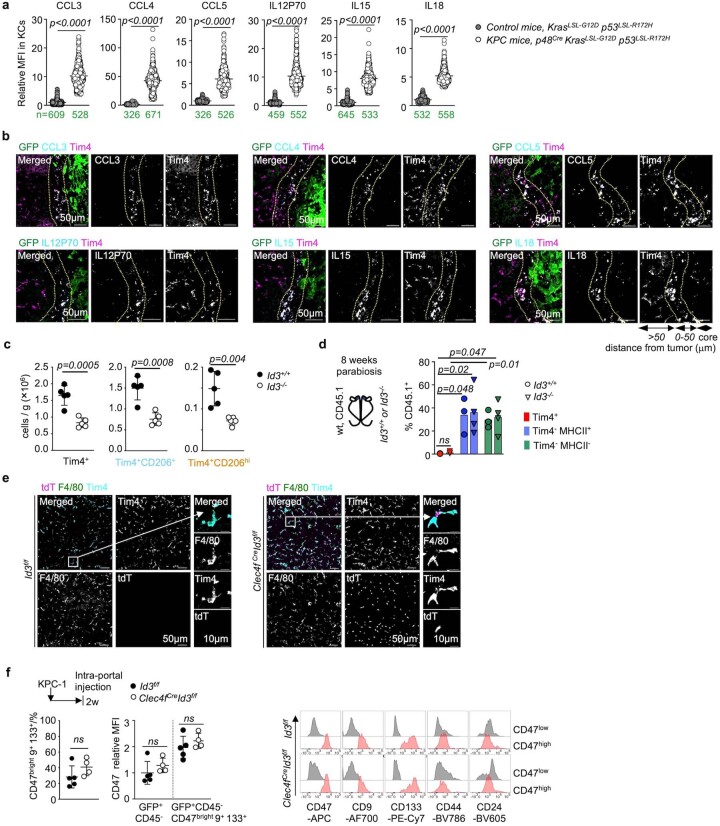
Extended Data Fig. 5. Related to Figs. 2 & 3. Analysis of Id3-deficient mouse models.
a- Quantification of cytokines/chemokines expression by Tim4+ KCs by immunofluorescence on liver tissue sections from KPC (p48Cre KrasLSL-G12D p53LSL-R172H) mice and control (KrasLSL-G12D p53LSL-R172H) mice. n numbers are indicated in green. Dots represent MFI of individual KCs. b- Representative micrographs of immunofluorescence staining for cytokines/chemokines on frozen liver sections from wt mice 2 weeks after intra-portal injection of 1 × 10⁶ KPC-1-gfp cells. n = 3 mice per group. c- Number of Tim4+ cells, Tim4+ CD206+ cells and Tim4+CD206hi cells per gram of liver tissue by flow cytometry in Id3−/− mice, and Id3+/+ littermates, n = 5 mice per group. d- Flow cytometry quantification Percentage of partner-derived (CD45.1+) wt Tim4+ KCs and Tim4− myeloid cells in the liver of CD45.2 Id3−/− mice (n = 4), or CD45.2 Id3+/+ mice (n = 3) parabiosed with wt CD45.1 mice for 8 weeks. e- Representative micrograph of Tim4, F4/80, and tdTomato expression by immunofluorescence in liver frozen section from 8 weeks old Id3f/f mice and Clec4fCreId3f/f mice. n = 3 mice per group. f- (left) Percentage of CD47brightCD9+CD133+ cells among GFP+CD45− tumour cells, and relative expression of CD47 among total GFP+CD45− tumour cells and GFP+CD45− CD47brightCD9+CD133+ tumour cells in the liver of Id3f/f mice(n = 5) and Clec4fCreId3f/f mice(n = 4) 2 weeks after intra-portal injection of 1 × 10⁶ KPC-1-luci-gfp cells. (right) representative histograms of CD47, CD9, CD133, CD44, and CD24 expression tumour cells from (left). Statistics: unpaired two-tailed t test (c,f). Mann-Whitney test(two-tailed) (a), One-way ANOVA (d). Dots represent individual mice (c,d,f), mean ± sd. ns, not significant.

