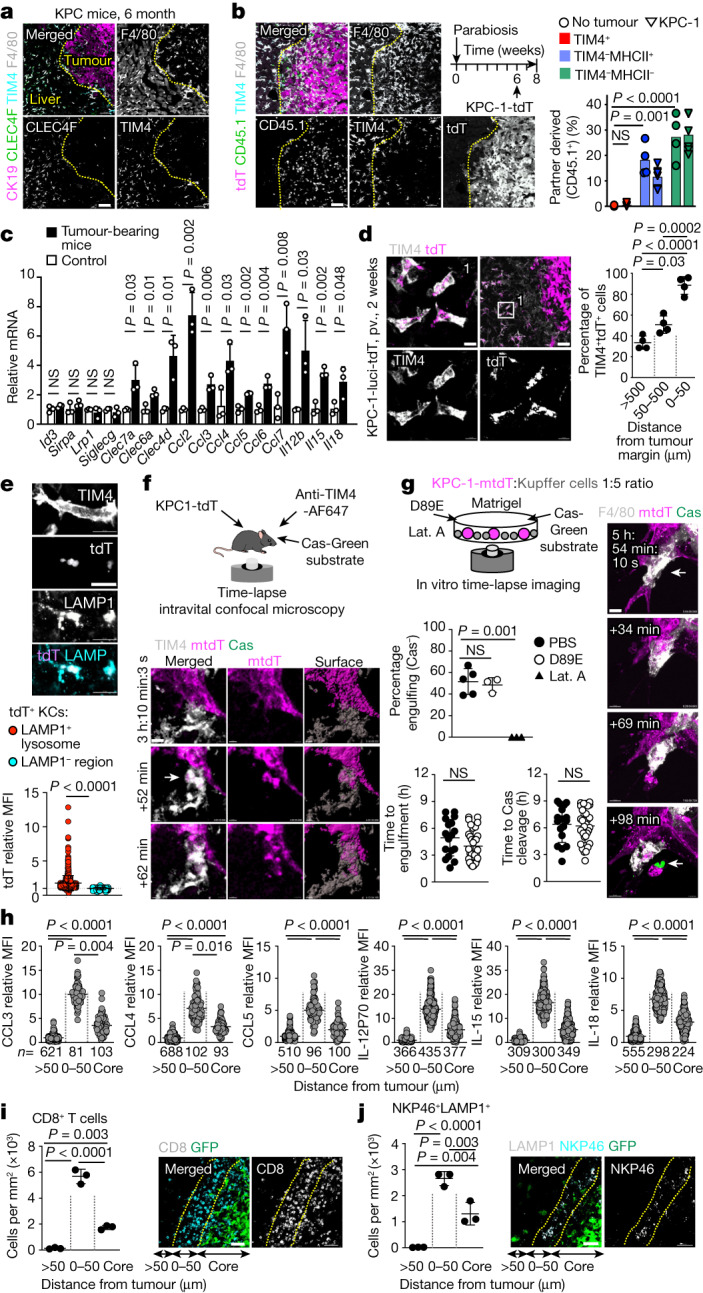
Fig. 2. Peritumoural niche.

a, Immunofluorescence staining of F4/80, TIM4, CLEC4F and CK19 on liver sections from 6-month-old KPC mice. n = 3 independent experiments. b, Immunofluorescence (left) and flow cytometry (right) analysis of CD45.1+ macrophages in the livers of the CD45.2 partners from CD45.1–CD45.2 parabiotic pairs, 2 weeks after intraportal injection of 1 × 10⁶ KPC-1-tdT cells in the CD45.2 partner (n = 5), or without tumour injection (n = 4). For a and b, scale bars, 50 μm. c, Analysis using quantitative PCR with reverse transcription (RT–qPCR) of the indicated genes in KCs, 2 weeks after intraportal injection of 1 × 10⁶ KPC-1-tdT cells or in control mice. n = 3 mice per group. d, Immunofluorescence staining and the percentage of TIM4+ KCs containing tdT in mice from c. n = 4. Scale bars, 10 μm (left) and 50 μm (right). e, tdT expression in LAMP1+ (n = 713) and LAMP1− (n = 237) areas in KCs from c. For e–g, scale bars, 10 μm. f, Engulfment of KPC-1-tdT cells by KCs in vivo was analysed using intravital imaging. KCs and dying cells were labelled by i.v. injection of F4/80-AF647 antibodies and Cas-Green, respectively. The arrow indicates engulfing KCs. n = 3. g, In vitro analysis of KPC-1 engulfment by KCs in the presence of PBS control (n = 5 experiments), phosphatidylserine blockade (MFG-E8(D89E); n = 3) or actin inhibitor (latrunculin A (lat. A); n = 3). KCs and dying cells are labelled as in f. The open arrow shows engulfing KCs. The closed arrow shows caspase-3/7 cleavage. The plots show the percentage of KCs engulfing Cas-Green− KPC-1-tdT cells, and the time from stable interaction between individual KCs (n = 17 (PBS) and n = 31 (MFG-E8(D89E))) and tumour cells to engulfment and caspase-3/7 cleavage. h, Expression of chemokines and cytokines by TIM4+ KCs (n values are shown) in tumour core and peritumoural liver (0–50 μm from tumour and >50 μm from tumour) 2 weeks after injection of 1 × 10⁶ KPC-1-GFP cells. i,j, representative staining and the number of CD8+ T cells (i) and LAMP1+NKP46+ cells (j) in the liver from h. n = 3 mice. For i and j, scale bars, 50 μm. Statistical analysis was performed using one-way analysis of variance (ANOVA) (b, d, g, i and j), two-tailed Mann–Whitney U-tests (e), Kruskal–Wallis tests (h) and unpaired two-tailed t-tests (c and g). Data are mean ± s.d. NS, not significant.
