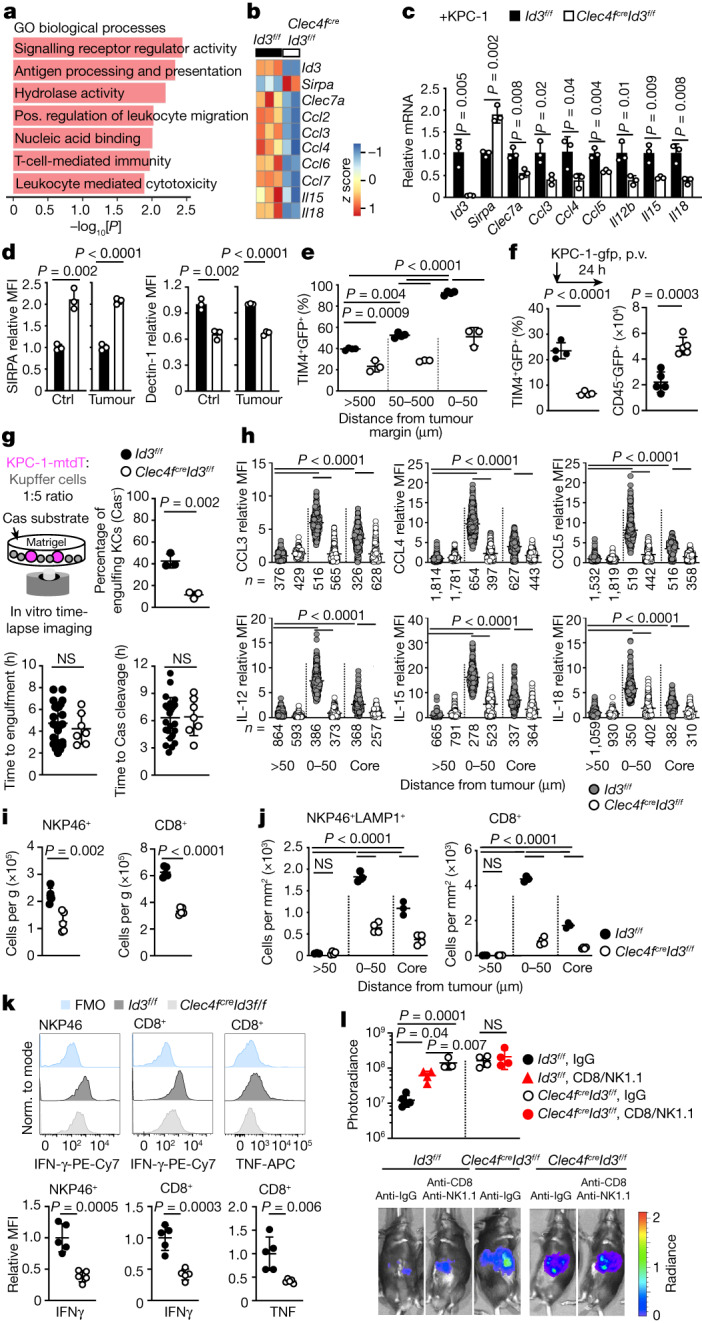
Fig. 4. ID3-dependent peritumoural niche.

a,b, RNA-seq analysis of KCs from Clec4fcreId3f/f mice (n = 2) and Id3f/f littermates (n = 3). a, The pathways downregulated in Clec4fcreId3f/f mice. Pos., positive. b, Selected differentially expressed genes. c, RT–qPCR analysis of selected genes in KCs from Clec4fcreId3f/f mice and Id3f/f littermates. n = 3 per group. d, Flow cytometry analysis of the expression of SIRPA and dectin-1 by KCs from Clec4fcreId3f/f mice and Id3f/f littermates 2 weeks after intraportal injection or not of 1 × 10⁶ KPC-1-GFP cells. n = 3 per group. Ctrl, control. e, The percentage of TIM4+ KCs containing GFP in the livers from Clec4fcreId3f/f mice (n = 4) and Id3f/f littermates (n = 3) treated as described in d. f, Immunofluorescence analysis of the percentage of TIM4+ KCs stained with GFP in Clec4fcreId3f/f mice and Id3f/f littermates 24 h after intraportal injection of 1 × 10⁶ KPC-1-GFP cells (left). n = 4 per group. Right, the number of CD45−GFP+ tumour cells per liver lobe was analysed using flow cytometry in the same mice. n = 5 per group. g, Engulfment of KPC-1-tdT cells by Clec4fcreId3f/f or Id3f/f KCs in vitro, as in Fig. 2g. The plots show the percentage of KCs engulfing Cas-Green− KPC-1-tdT cells (n = 3 per group), and the time from stable interaction between KCs (n = 25 (Id3f/f) and n = 7 (Clec4fcreId3f/f)) and tumour cells to engulfment or caspase-3/7 cleavage. h, Expression of chemokines and cytokines by TIM4+ KCs from Id3f/f and Clec4fcreId3f/f mice treated as in d. n values are indicated. i,j, Flow cytometry (i) and immunofluorescence (j) analysis of CD8+ T cells and LAMP1+NKP46+ cell numbers per g of liver or per mm2 in mice from h. n = 5 mice per group. k, IFNγ and TNF expression by NKP46+ and CD8+ T cells from i and j. l, The liver tumour burden was analysed using photoradiance 2 weeks after injection of 1 × 10⁶ KPC-1-luci cells in Id3f/f mice treated with IgG (n = 6) or anti-CD8/NK1.1 (n = 3) and Clec4fcreId3f/f mice treated with IgG or anti-CD8/NK1.1. n = 4 per group. Statistical analysis was performed using unpaired two-tailed t-tests (c, d, f, g, i, k and l), one-way ANOVA (e, j and l) and Kruskal–Wallis tests (h). Data are mean ± s.d. Norm., normalized.
