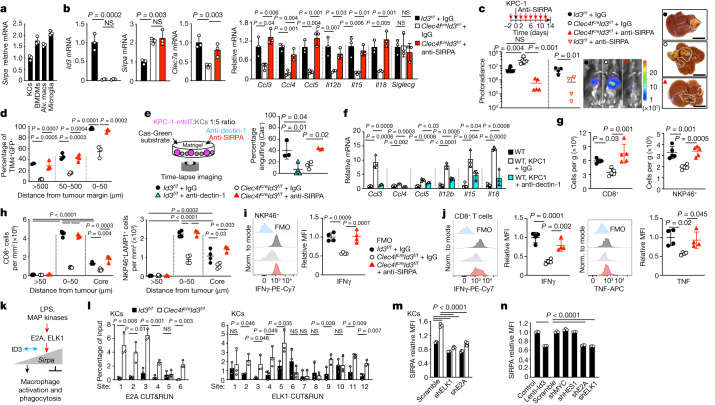
Fig. 5. SIRPA and dectin-1 mediate, in part, ID3 function.
a, RT–qPCR analysis of Sirpa mRNA in macrophages from three C57BL/6J mice. b–d, Analysis of Clec4fcreId3f/f mice and Id3f/f littermates 2 weeks after intraportal injection of 1 × 10⁶ KPC-1-luci cells and treatment with anti-SIRPA or IgG control antibodies. b, RT–qPCR analysis of the indicated gene mRNA in KCs. n = 3 mice per group. c, Photoradiance and histology analysis of the liver tumour burden (Id3f/f + IgG, Clec4fcreId3f/f + IgG or Clec4fcreId3f/f + anti-SIRPA (n = 5 per group); Id3f/f + IgG and Id3f/f + anti-SIRPA (n = 4 per group)). Scale bars, 1 cm. d, The percentage of TIM4+ KCs containing GFP+ material in the peritumoural niche. n = 4 (Id3f/f + IgG and Clec4fcreId3f/f + IgG) and n = 3 (Clec4fcreId3f/f + anti-SIRPA). e, In vitro engulfment of live KPC-1-membrane-tdT (KPC-1-mtdT) cells (Fig. 2g) by KCs from Id3f/f mice treated with IgG (n = 3 independent experiments) or anti-dectin-1 antibodies (n = 4) and Clec4fcreId3f/f littermates treated with IgG or anti-SIRPA antibodies (n = 3 per group). f, RT–qPCR analysis of mRNA gene expression by wild-type (WT) KCs that were or were not cocultured with KPC-1 cells for 12 h in the presence of anti-dectin-1 or control IgG antibodies. n = 3 per group. g–j, Flow cytometry analysis of the numbers of CD8+ T cells and NK cells (g; n = 5 per group), immunofluorescence analysis (h; n = 4 per group) and analysis of the production of cytokines by CD8+ T cells (j) and NK cells (i) (n = 4 per group) in tumoural liver from mice treated as described in b–d. k, Hypothesis for the regulation by ID3 of Sirpa transactivation in macrophages. l, CUT&RUN analysis of E2A and ELK1 binding to Sirpa predicted promoter/enhancer regions in KCs from Clec4fcreId3f/f mice and Id3f/f littermates. n = 3 per group. m, Flow cytometry analysis of SIRPA expression by KCs from Id3+/+ mice and Id3−/− littermates, expressing scramble, E2a or Elk1 shRNAs (n = 3 per group). n, Flow cytometry analysis of SIRPA expression by mouse BMDMs expressing lenti-Id3, lenti-control or the indicated shRNAs. n = 3 per group. Statistical analysis was performed using one-way ANOVA (b–j, m and n) and unpaired two-tailed t-tests (c and l). The dots represent individual mice (a–d and g–j). Data are mean ± s.d.

